Showing posts with label Greenland. Show all posts

Sunday, February 9, 2014

High methane readings over Greenland

High methane readings have been recorded over Greenland since the start of February 2014. The image below shows methane readings of 1950 ppb and higher in yellow on February 9, 2014.


The animation below shows that high methane readings (1950+ ppb in yellow) have been showing up over Greenland since the start of February 2014.

[ Note: this animation is a 3.28 MB file that may take some time to fully load ]
What could have caused these high methane readings? The persistence with which the methane shows up over Greenland indicates that it did indeed originate from Greenland.

The above animation also illustrates that high methane readings show up every other image. The IASI readings come from a satellite that is orbiting the poles twice daily, with a 12-hour interval, so the satellite passes the North Pole twice every day. This makes that the images follow a day-versus night pattern, indicating that the high methane readings follow a circadian rhythm, suggesting a pattern that is in line with temperature differences between day and night.

There often is a difference in methane readings between day and night, but rarely is it as distinct as is currently the case over Greenland. And indeed, more is currently happening to temperatures over Greenland than mere differences in temperature between day and night.

As discussed in earlier posts such as this one, the once-common temperature difference between the Arctic and lower latitudes has been shattered, and this is weakening the Jet Stream and the Polar Vortex, in turn making it easier for cold air to flow down to lower latitudes and for warmer air to enter the Arctic. As a result, temperatures over Greenland can go from one extreme to another and back, as illustrated by the image with selected cci-reanalyzer.org forecasts below.

[ click on image to enlarge ]
Above image shows that, in some areas over Greenland, temperature anomalies may go down as low as as minus 20 degrees Celsius one day, then climb as high as 20 degrees Celsius a few days laters, to hit temperature anomalies as low as minus 20 degrees Celsius again some days later. These are swings of 40 degrees Celisus that can hit an area over the course of a few days. 

This could explain the methane over Greenland. Methane is present in the Greenland ice sheet in the form of hydrates and free gas. These huge temperature swings are causing the ice to expand and contract, thus causing difference in pressure as well as temperature. The combined shock of wide pressure and temperature differences is causing movement and fractures in the ice allowing methane to rise to the surface and enter the atmosphere.

The image below puts things in perspective, comparing methane over Greenland with methane over the Arctic Ocean.


Above image shows that the amounts of methane over Greenland are huge, while methane is still being released from the seafloor of the Arctic Ocean, in particular along the faultline that runs from the north of Greenland to the Laptev Sea. 

Few people seem to have anticipated these methane releases from the mountains of Greenland. Even worse, similar processes could be going at times on Antarctica, the Himalayas and the Qinghai-Tibet Plateau. I warned about this danger, e.g. in the May 2013 post Is Global Warming breaking up the Integrity of the Permafrost?. The danger that methane will be released in large (and growing) quantities from hydrates and free gas contained in the ice over mountains appears to have been ignored by the IPCC, which puts more weight on my estimate that methane release from hydrates currently amounts to 99 Tg annually, vastly more than the most recent IPCC estimates of 6 Tg per year. 

Without action on climate change, these methane releases threaten to rise even further and cause runaway global warming. This calls for comprehensive and effective action as discussed at the Climate Plan blog


Wednesday, January 8, 2014

High Methane Levels over Arctic Ocean continue in 2014

The high methane levels over the Arctic Ocean, the biggest story of 2013, continue in 2014, as illustrated by the image below.


As above image shows, high methane readings (as high as 2301 ppb on January 6, 2014) continue in 2014. High methane concentrations continue to enter the atmosphere where the sea ice is thin and where the sea ice is carried by currents outside of the Arctic Ocean.

The inset shows ice thickness on January 6, 2014. The inset highlights the huge amounts of sea ice that are carried by the sea current from the north of Greenland into the Atlantic Ocean.

What is the impact of these high methane releases over the Arctic Ocean on global methane levels? The image below shows the most recent global methane levels available from NOAA.


The image below shows readings from surface flask at Mauno Loa, Hawaii, with two recent readings (in the top right corner) reaching levels close to 1880 ppb.


Clearly, methane levels are rising globally and high releases over the Arctic Ocean are contributing to the global rise. The images below show recent data from stations in the Arctic, i.e. the image below showing readings from in situ measurements at the station at Barrow, Alaska, and the image further below showing flask samples taken at Tiksi, Russia.


Note that the above images reflect land-based measurements taken at altitudes that are typically too low to capture the extent at which methane is rising in the atmosphere over the Arctic Ocean. Nonetheless, the wind can at times carry along some of the methane from the Arctic Ocean, as is apparent in a number of readings in above images showing levels of over 2100 ppb.

The image below shows high methane releases over the Arctic Ocean, as recorded on (part of) January 7, 2014, when levels were reached as high as 2381 ppb.


The image below shows methane levels on (part of) January 8, 2014, when levels as high as 2341 ppb were recorded. The inset confirms indications that these high levels originate from the Arctic Ocean.


These high methane concentrations over the Arctic are contributing to high temperature anomalies that further accelerate warming in the Arctic, as illustrated by the image below.


For a more detailed description of the kinds of warming and feedbacks that are hitting the Arctic, see the post The Biggest Story of 2013.


Thursday, December 26, 2013

Sea Ice in decline between Svalbard and Greenland

[ click on image to enlarge ]
Above image shows that Earth's highest atmospheric methane concentrations are recorded over the Arctic Ocean. The insets show lower methane concentrations over various continents, North and South America (top left), Europe (mid right), Australia bottom left) and Antarctica (bottom right).

The top right inset shows sea ice thickness, illustrating that methane is escaping from the sea floor of the Arctic Ocean and is transported by currents to the thinner edges of the sea ice, where it is entering the atmosphere.

As discussed in a recent post, methane can be bubbling up in the Arctic Ocean with a force strong enough to prevent sea ice from forming in the area. This feedback is depicted in the Diagram of Doom further below as feedback #13.


Around this time of year, Arctic sea ice is typically growing rapidly, both in extent and thickness.

However, the above image shows that in the area marked by the white circle, between Svalbard and Greenland, the sea ice is actually in decline.

[ click on image to enlarge ]
This decline is caused by methane that is entering the atmosphere in the area as warmer water continues to be transported by the Gulf Stream into the Arctic Ocean, as discussed in previous posts such as this one, and as also illustrated by the image on the right.

Warmer than average waters have been entering the Arctic Ocean along the Gulf Stream since July 2013, when changes to the Jet Stream contributed to waters off the North American coast reaching record warmest temperatures, as depicted in the Diagram of Doom below as feedback #11.

In summary, the above images show that methane makes it hard for ice to form, while the warm water of the West Spitzbergen Current is pushing the ice away, breaking up even the thickest ice to the north of Greenland.

Surface temperatures in the area have been extremely high recently. This part of the Arctic Ocean was hit by an 18+°C anomaly during the week from December 16 to December 22, 2013, as illustrated by the image below.


On some days that week, anomalies of 20+°C were recorded over an even larger part of the Arctic Ocean, as described in a previous post. These anomalies show how a number of feedbacks can interact and contribute to huge warming peaks in the Arctic Ocean, such as methane releases (feedbacks #2 and #13 in the diagram below) and changes to the Jet Stream (feedbacks #10 and #11 in the diagram below).

This spells bad news for the sea ice. Some people may have hoped that the thicker sea ice north of Greenland would take decades to disappear. However, as depicted in the Diagram of Doom below, feedbacks can hugely accelerate sea ice decline. As sea ice declines further, more open water make it more likely that stronger storms and cyclones will appear that can rip the sea ice apart and move the pieces into the Atlantic Ocean in a matter of days.

The image below, by Jim Pettit, illustrates the ongoing decline of the sea ice.


Thirteen feedbacks that can accelerate warming in the Arctic are depicted in the diagram below.


Specific feedbacks are described in the following posts:
- Diagram of Doom
- Further feedbacks of sea ice decline in the Arctic
- Causes of high methane levels over Arctic Ocean
- Methane Release caused by Earthquakes
- How Do We Act in the Face of Climate Chaos?
- The astounding global warming impact on our oceans . . .
- Methane emerges from warmer areas
Feedbacks are pictured in a more general way in the image below.


Above image shows how the accumulation of the many feedbacks and their interaction leads to ever stronger albedo changes, while the resulting accelerated warming in the Arctic causes increasing quantities of methane to be released from the seafloor of the Arctic Ocean, in turn leading to runaway global warming, as also pictured in the image below.

[ click on image to enlarge ]
As above image shows, a polynomial trendline already points at global temperature anomalies of 5°C by 2060. Even worse, a polynomial trendline for the Arctic shows temperature anomalies of 4°C by 2020, 7°C by 2030 and 11°C by 2040, threatening to cause major feedbacks to kick in, including albedo changes and methane releases that will trigger runaway global warming that looks set to eventually catch up with accelerated warming in the Arctic and result in global temperature anomalies of 20°C+ by 2050.

To reduce these risks, comprehensive and effective action is needed, such as described at the Climate Plan blog.

Thursday, November 21, 2013

High Methane Levels all over Arctic Ocean

High levels of methane were recorded all over the Arctic Ocean on November 19, 2013, as illustrated by the image below. The image also shows that most methane was present over the fault line that crosses the Arctic Ocean (as also indicated on the inset).

[ Click on image to enlarge ]
A recent post described that more methane may actually be present closer to the North Pole than IASA images may indicate. This because measurements can be obscured by clouds. If no data are recorded over a certain area, no methane levels will show up on images for the respective area. This was the case on November 17, 2013, when the Arctic Ocean was quite cloudy, and little or no data were recorded for the center of the Arctic Ocean.

On November 19, 2013, the sky was much clearer, resulting in a lot of data from the center of the Arctic Ocean, as also illustrated by the image below.

In conclusion, high methane levels can actually be present all over the Arctic Ocean, even when images only show high levels in some areas.

An earlier post described how the sea ice can act as a shield, especially when the ice is more than one meter thick.

How does this rhyme with the above image? The November 19, 2013, Naval Research Laboratory image on the right shows that the sea ice was meters thick in some locations where methane shows up on the top image.

So, is methane actually rising from the seafloor of the entire Arctic Ocean, perforating even the thickest ice and entering the atmosphere all across the Arctic Ocean? Or, if thick sea ice does act as a shield, how did methane appear all over the Artic Ocean in such huge quantities?

The images on the right indicate that the methane may actually only rise from the seafloor in a few locations.

As the top image on the right says, the Coriolis Effect can make methane over the Laptev Sea end up over Canada a few days later. So, methane may not be perforating the sea ice in the north of Canada, but may instead originate from elsewhere in the Arctic.

The animation underneath shows methane readings from November 9 to 19, 2013, with each of the 20 frames covering a period of 24 hours and with frames following each other up 12 hours after each other. As the animation shows, it looks like methane is predominantly entering the atmosphere at specific locations, most notably along the fault line that crosses the Arctic Ocean.

It may well be that this methane ends up all the way in Baffin Bay, to the left of Greenland. Since the Greenland ice sheet is 3 kilometers (1.9 miles) thick, this may form a natural barrier that keeps the methane there, also helped by winds rising vertically from Baffin Bay to well above Greenland's mountains. Methane may also be traveling under the sea ice, all the way from the Gakkel Ridge and the Laptev Sea right to Baffin Bay.

On the other hand, it could also be that hydrates underneath the sea bed of Baffin Bay itself have become destabilized and that, since the ice over Baffin Bay is rather thin, methane has no problem perforating the ice and is entering the atmosphere there in huge quantities.

Either way, the end-conclusion is that the methane that is now showing up all over the Arctic Ocean, is rising from the seafloor, due to destabilization of sediments that hold huge amounts of methane in the form of free gas and hydrates. As warming in the Arctic continues to accelerate, the danger is that this will cause more methane to rise from the seafloor and that the methane itself will contribute to warming in the Arctic, in a deadly spiral set to cause abrupt climate change at a devastating scale.


Saturday, November 16, 2013

More Methane as Sea Ice thins

The image below shows methane readings of 1950 ppb and higher, as at November 15, 2013, p.m., close to sea level. The image also shows sea ice concentration, as at November 7, 2013, i.e. the most recent SSMIS data available on methanetracker.

[ click on image to enlarge ]
The image shows huge amounts of methane rising from the seafloor along the fault line that crosses the Arctic Ocean. The image also shows huge amounts of methane over thinner parts of the sea ice. To illustrate this further, the November 15, 2013, Naval Research Laboratory image is added below, showing ice thickness based on the most recent sea ice data.


The image below zooms in on the large amounts of methane, stretching out all the way from the Beaufort Sea to Baffin Bay.

[ click on image to enlarge ]
Above image illustrates that methane does show up prominently where the sea ice is thin, confirming earlier conclusions that the sea ice acts as a shield, a seal if you like, holding the methane in place and thus giving microbes the time needed to decompose the methane while it is held underneath the ice.

This spells bad news, because it implies that, as the sea ice thins, more methane will be able to enter the atmosphere and contribute to warming that is already accelerating in the Arctic.

As discussed in a recent post, methane is rising from the seafloor of the Arctic Ocean due to destabilization of sediments that hold huge amounts of methane in the form of free gas and hydrates. This destabilization is in part due to warm water flowing in the Arctic Ocean along the Gulf Stream. Record warm water was present off the coast of North America in July 2013, and this warm water took some time to reach the Arctic Ocean, as shown on the image below, from that earlier post.


Water in the currents that are returning water to the Atlantic Ocean north of Canada is typically cold, as indicated by the blue color on the image below. So, while it is possible that the water was still sufficiently warm to cause methane releases from the seabed in the Beafort Sea and in Baffin Bay, in the northern parts of Canada, it seems more likely that the methane originated from areas along the fault line that crosses the Arctic Ocean and that the methane traveled - underneath the sea ice - with these currents all the way to the edges of the sea ice where the ice is sufficiently fractured and thin to allow methane to rise to the surface.

Image credit: Jack Cook, Woods Hole Oceanographic Institute
This seems confirmed by recent sea surface temperature data, as pictured below.


As above image shows, sea surface temperature anomalies (in orange, red and brown) are still showing up prominently along many parts of the Gulf Stream, all the way into the Arctic Ocean, where anomalies of more than 8 degrees Celcius have been recorded for some time now. At the same time, colder water (in green and blue) is flowing back into the Atlantic Ocean from the Arctic Ocean, along the edges of Greenland and further south. Colder currents typically flow at greater depth, but the above image also shows colder waters emerging at sea surface level, especially in areas somewhat off the coasts of Newfoundland and Nova Scotia, effectively preventing some warm water from traveling along the Gulf Stream to the Arctic Ocean.

Why are the currents that are flowing out of the Arctic Ocean into the Atlantic Ocean so strong at the moment? Powerful winds have speeded up these currents, as illustrated by the 30-days Naval Research Laboratory animation below, which also includes a 7-days forecast from November 15, 2013.


One of the feedbacks of accelerated warming in the Arctic is stronger winds and a huge amount of sea ice is currently flowing into the Atlantic Ocean, partly due to these strong winds. Similarly, the Naval Research Laboratory animation below shows huge amounts of sea ice, often very thick ice, being pushed into the Atlantic Ocean.


Last but not least, the youtube video below, Arctic Death Spiral and the Methane Time Bomb, shows some of the most powerful video footage on climate change, highlighting the danger that methane will continue to rise from the seafloor of the Arctic Ocean in ever greater quantities, resulting in a wipe-out of civilization, extinctions at massive scale and devastation of the planet as we know it.


Sunday, August 11, 2013

Dramatic rise in methane levels since end July 2013

There has been a dramatic rise in methane levels since end July 2013. The image below pictures methane levels above 1950 ppb on the Northern Hemisphere from 12 p.m. August 9, 2013, to 12 a.m. August 10, 2013.


[ click on image to enlarge ]
Quite suddenly, readings above 1950 ppb have become commonplace since July 31, 2013.


The chart below illustrates the dramatic jump in methane levels that occurred since July 31, 2013. The chart shows the area (square km) with methane readings over 1950 ppb for selected layers, over the period from July 24, 2013, to August 9, 2013. The chart further below shows that peak methane levels have increased dramatically.

Particularly worrying are high levels of methane over the Arctic Ocean, such as on the image below showing methane levels over 1950 ppb in yellow for selected layers on August 5, 2013 (a.m.).
[ click on image to enlarge ]
Methane levels are also very high on the Southern Hemisphere, as illustrated by the image below on the right. High readings have featured over the heights of Antarctica for quite some time, but the high levels of methane over the oceans on the Southern Hemisphere have only shown up recently. They could be caused by one or more methane hydrates getting destabilized in the ocean between Antarctica and South America.
[ click on image to enlarge ]
Peter Carter sent the image below, edited from NOAA Earth System Research Laboratory, showing high (and rising) methane levels in Pallas Sammaltunturi (north Scandinavia), measured with surface flasks.

Peter also added the image below, pointing at high methane levels in Lac La Biche, Northern Alberta, Canada. What to make of it?, Peter adds, It is not far from the Tar Sands - that does have a methane problem, but it is basically wetland peat region vicinity which is why I checked it.

Monday, March 18, 2013

Huge patches of warm air over the Arctic

Over the past month or so, huge patches with temperature anomalies of over 20 degrees Celsius have been forming over the Arctic.

The three images below show such patches stretch out from Svalbard to Novaya Zemlya (top), north of Eastern Siberia (middle) and over West Greenland and Baffin Bay (bottom).


How these patches with warm air developed is further illustrated by the animation below, which goes from February 12, 2013, to March 18, 2013.


This is a 2.3 MB file that may take some time to fully load. 

Paul Beckwith, regular contributor to the Arctic-news blog, comments:
Paul Beckwith,
B.Eng, M.Sc. (Physics),
Ph.D. student (Climatology)
and Part-time Professor,
University of Ottawa
 

"The problem with this type of pattern is that there is a tendency for what is termed the AD (Arctic Dipole) consisting of exceptionally high pressures over Northern Canada to Greenland. When the air leaves this region heading for the low pressure regions (winds) it curves to the right (due to Coriolis force) and is thus driven from the Bering Strait region to the North Pole and then out Fram Strait, this conduit is like flushing the toilet on the ice. Warm water is pulled to the cold North Pole and the ice is driven out the Fram Strait into the warm Atlantic where it is melted."

"But the really big problem is that this high pressure area over Northern Canada is a ridge (blocking) that stays pretty stationary over the summers and is directly causing the heat waves and drought in the western US (2003, 2011, 2012). Another really big problem is that the part of the ridge over Greenland (or large GBI = Greenland Blocking Index); as discussed by Overland, Francis, et. al. in 2012 causes excessive melt in Greenland (as we saw in July, 2012 when 97% of Greenland was melting on the surface instead of the usual 40%). This is sending the Greenland albedo into a steep drop, causing even more heat absorption and melting."

To illustrate this further, Paul adds the animation below, from weather.unisys.com.

This animation is a 1 MB file that may take some time to fully load
Paul adds: "The Greenland high could reach 1070 mb in next few days; that will bring huge temperatures! By comparison, the world record highest was 1085 in Mongolia in December 19, 2001".

The 1070 mb high over Greenland is further illustrated by the image below, from weather.unisys.com.


Indeed, as the jet stream slows down and becomes more wavier, such patches of warm air can be expected to extend more regularly into the Arctic. The result can be a huge melt of Arctic sea ice, as well as a huge melt of snow cover in Greenland, which also dramatically lowers albedo, as occurred in 2012 and as discussed in the earlier post Greenland is melting at incredible rate.

This spells bad news for the Arctic sea ice, which may well disappear altogether this summer.

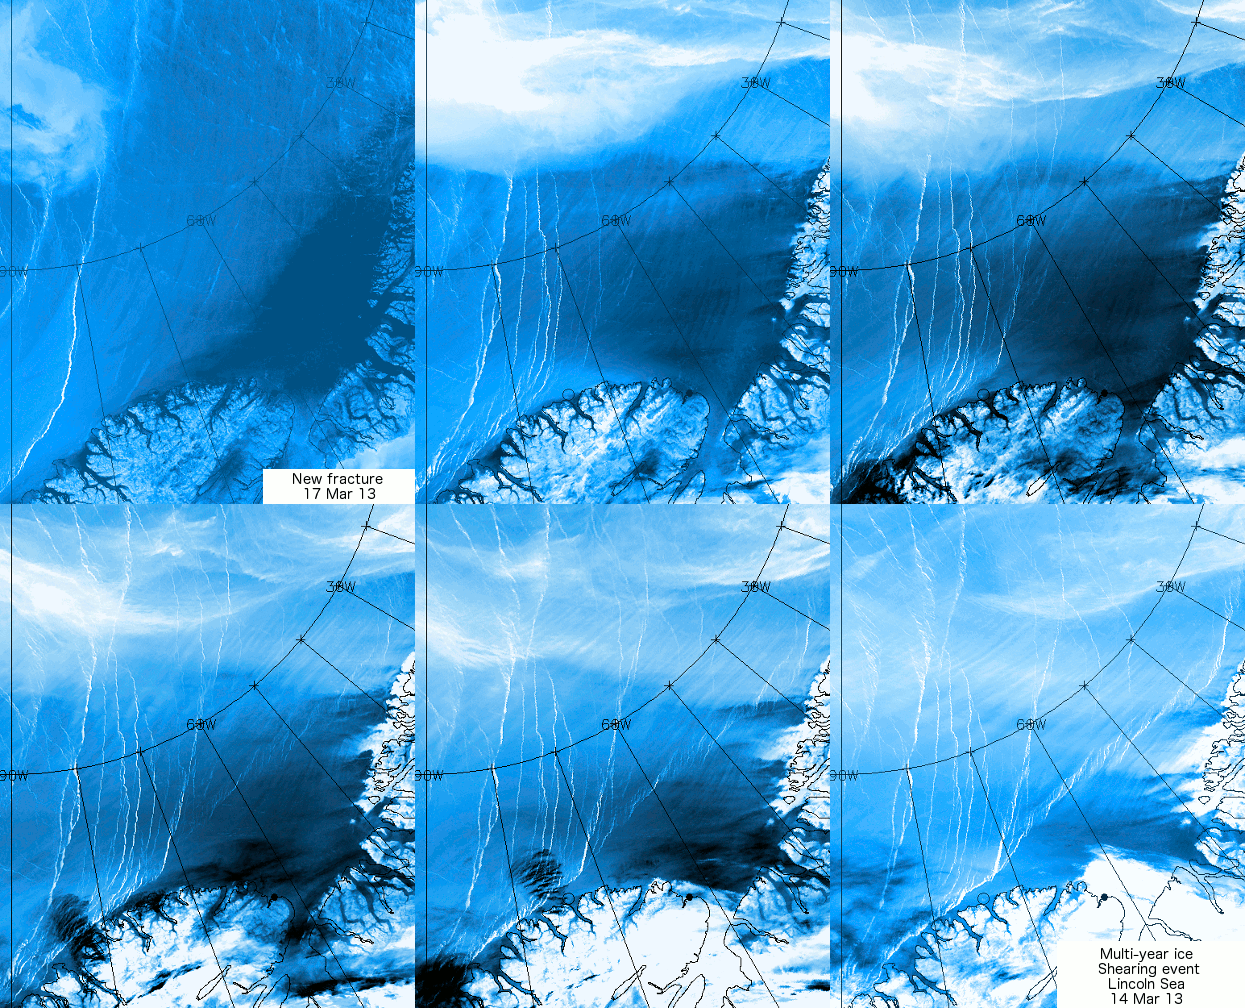
Paul further adds: "For the record; I do not think that any sea ice will survive this summer. An event unprecedented in human history is today, this very moment, transpiring in the Arctic Ocean. The cracks in the sea ice that I reported on my Sierra Club Canada blog and elsewhere over the last several days have spread and at this moment the entire sea ice sheet (or about 99% of it) covering the Arctic Ocean is on the move. Clockwise. The ice is thin, and slushy, and breaking apart."

"This is abrupt climate change in real-time. Humans have benefitted greatly from a stable climate for the last 11,000 years or roughly 400 generations. Not any more. We now face an angry climate. One that we have poked in the eye with our fossil fuel stick and awakened. And now we must deal with the consequences. We must set aside our differences and prepare for what we can no longer avoid. And that is massive disruption to our civilizations."

The animation below, from genomewiki.ucsc.edu shows cracks in the sea ice with the Wikipedia image underneath showing the location.


Related posts

- Polar jet stream appears hugely deformed
- Hurricane Sandy moving inland

Thursday, February 7, 2013

Arctic Sea ice Volume and Greenland Melt Update

Arctic Sea Ice Volume

The image below, from the ArctischePinguin site, shows the current volume of Arctic sea ice, updated with PIOMAS data from the Polar Science Center of the University of Washington.
As the above image shows, a minimum volume of 3000 cubic km is expected to be reached in September 2013 (red dotted line), with a margin of error that allows for the sea ice to disappear altogether in a few months time.

The image below updates the exponential trends for each month.

Greenland Melt

Meanwhile, the National Snow and Ice and Data Center (NSIDC) has started a page with daily updates of the extent of the Greenland melt. The image below pictures the Greenland melt in 2012 on the left, and the situation up to February 6, 2013 on the right.