Showing posts with label anomalies. Show all posts

Saturday, February 15, 2014

Extreme weather strikes around the globe - update

As the weather gets more extreme, disaster strikes around the globe. The Guardian reports three people killed as storms continue to batter southern UK. The Vancouver Sun reports that a U.S. Northeast snowstorm kills 25. And the Sacramento Bee reports Six dead and 1,000 injured in fresh Japan snow storm.

What is the story behind these extreme weather events? The image below tells the story. The Arctic has been much warmer than it used to be, due to numerous feedbacks that accelerate warming in the Arctic. This reduces the temperature differential between the Arctic and lower latitudes, which changes the Jet Stream and Polar Vortex, in turn making the weather at many places ever more extreme.

 earlier forecasts by cci-reanalyzer.org
Above image illustrates the situation, showing an Arctic Ocean that is warmer than the higher latitudes of the Asian and North American continents.

Arctic sea ice has meanwhile reached record lows, as illustrated by the image below.


The situation can be expected to get even worse. The image below shows sea ice extent, as measured by the NSIDC, which is one day ahead compared to above image.


Below, two regular contributors to the Arctic-news blog comment on the situation.


    Paul Beckwith:

Paul Beckwith with sign (arrows highlighted by Sam Carana, from earlier post)
In the video below, Paul Beckwith discusses the above sign and the situation in general.


Dr. Malcolm Light, Earth Scientist, comments:


The volume of water transported by Gulf Stream off the east coast of the United States has increased by three times since the 1940s due to a massive increase in wind drag. This increase in the south westerly wind drag is a result of the continuously increasing pressure difference set up between the continental air mass over North America, heated by fossil - fuel generated carbon dioxide, and the marine air of the Atlantic.

The increased energy entering the Gulf Stream as heat and its associated winds and storm systems are what are now pummeling Great Britain and Europe. This heat is also transported further north by branches of the Gulf Stream into the Arctic Ocean, where it is destabilizing the subsea methane hydrates, releasing increasing volumes of methane into the Arctic atmosphere and causing temperature anomalies this last winter of more than 20 degrees Celsius.

As a consequence of the extremely high Arctic temperatures and pressures, the normal freezing Arctic air has been displaced into Canada and the United States, causing catastrophic blizzards that have never been seen before. When the floating Arctic ice cap melts towards the end of next year, the Arctic Ocean will then become more aggressively heated by the sun and the northern offshoots of the Gulf Stream.

Under these circumstances, the cold Arctic air will be confined over the Greenland ice cap and the Arctic atmosphere will rotate anticlockwise around Greenland, transferring the fast-increasing amounts of its atmospheric methane to Canada and the United States and causing a further increase in the energy of the Gulf Stream.

Therefore the United Kingdom and Europe must brace themselves for even more catastrophic weather systems, widespread flooding and massive wind damage from the start of the last quarter of next year.


Below is a comparison of methane readings for the week from February 9 to 16, 2014, compared to the same period in 2013.


The comparison shows that there is a lot of methane over the Arctic Ocean that wasn't there last year. Furthermore, high methane readings show up where currents move the sea ice out of the Arctic Ocean, in areas such as Baffin Bay. This indicates that methane that is released from the seafloor of the Arctic Ocean appears to be moving underneath the ice and entering the atmopshere where the sea ice is fractured or thin enough to allow the methane to pass through.

Also note that more orange areas show up on the southern hemisphere in 2014, indicating that more methane from the northern hemisphere is now spreading south beyond the equator. This in addition to indications that more methane is rising and building up at higher altitudes, as discussed in an earlier post.

As said before, the situation calls for comprehensive and effective action, as discussed at the Climate Plan blog.


Monday, February 10, 2014

Extreme weather strikes around the globe

  Editorial note: this post has meanwhile been updated as
Extreme weather strikes around the globe update.


As the weather gets more extreme, disaster strikes around the globe.

Here's a snapsnot from today's news. In London, the BBC reports, flooded homes along the River Thames are being evacuated and thousands more are at risk. In Japan, reports Reuters, eleven people died, more than a thousand were injured and tens of thousands lost power when the worst snowstorm in decades hit Tokyo and areas around the Japanese capital before heading north to blanket the tsunami-hit Pacific coast. Many countries in the Middle East were hit by snow. The BBC reports that heavy snow in northern Iran has left around 480,000 homes without power and some towns and villages cut off.

What is causing these extreme weather events? The image below tells the story. While at times it has been cold at many places around the world, when averaged over the past 30 days, temperatures around the globe have actually been several degrees higher than they used to be. The Arctic has been hit hardest, with anomalies as high as 21°C over this 30 day period. This affects the Jet Stream and Polar Vortex, which in turn is making the weather ever more extreme.


The situation is further illustrated by the cci-reanalyzer.org forecasts below.


And while the sea ice didn't look too bad at the start of the year, growth has meanwhile stopped, as illustrated by the image below.


Added below are two videos by Paul Beckwith, further discussing the situation.


Editor's note: Reanalysis of temperature anomaly Jan 12 - Feb 10, 2014.
Meanwhile, I've added another image (above), created with NOAA's reanalysis, which compares temperatures to a larger dataset, and the colors look a lot different, so NOAA may indeed have mixed the colors up somewhat in the initial image, as Albert suggested at the Facebook discussion (click on image below).

Anyway, the point made in the post remains, i.e. that as global warming continues, warming in the Arctic accelerates more rapidly than at lower latitudes, which weakens the polar vortex and jet stream in a self-reinforcing feedback that causes the Arctic to warm up even further compared with lower latitudes.

As said, the situation calls for comprehensive and effective action, as discussed at the Climate Plan blog.


Tuesday, February 4, 2014

As continental U.S. freezes, Alaska gets record high temperatures

While much of the continental United States endured several cold snaps in January 2014, record-breaking warmth gripped Alaska. Spring-like conditions set rivers rising and avalanches tumbling. NASA Eartobservatory illustrates the above words with the two images below.


Above map depicts land surface temperature anomalies in Alaska for January 23–30, 2014. Based on data from the Moderate Resolution Imaging Spectroradiometer (MODIS) on NASA’s Terra satellite, the map shows how 2014 temperatures compared to the 2001–2010 average for the same week. Areas with warmer than average temperatures are shown in red; near-normal temperatures are white; and areas that were cooler than the base period are blue. Gray indicates oceans or areas where clouds blocked the satellite from collecting usable data.

A persistent ridge of high pressure off the Pacific Coast fueled the warm spell, shunting warm air and rainstorms to Alaska instead of California, where they normally end up. The last half of January was one of the warmest winter periods in Alaska’s history, with temperatures as much as 40°F (22°C) above normal on some days in the central and western portions of the state, according to Weather Underground’s Christopher Bart. The all-time warmest January temperature ever observed in Alaska was tied on January 27 when the temperature peaked at 62°F (16.7°C) at Port Alsworth. Numerous other locations—including Nome, Denali Park Headquarters, Palmer, Homer, Alyseka, Seward, Talkeetna, and Kotzebue—all set January records.

The combination of heat and rain has caused Alaska’s rivers to swell and brighten with sediment, creating satellite views reminiscent of spring and summer runoff. On January 25, 2014, the Aqua satellite collected this image of sediment flowing into the Gulf of Alaska from numerous rivers along the state’s southeastern coast.

All of the heat, moisture, and melting snow has elevated the risk of avalanches. A series of extremely large avalanches in late January sent snow and debris crashing onto the Richardson Highway, blocking the road and cutting the port town of Valdez off from highway access. The avalanches dumped a mound of snow 100 feet (30 meters) tall and up to 1,500 feet (460 meters) long on the highway.


Below are two videos with forecasts for the period from February 4, 2014, to February 11, 2014. The top video shows temperature forecasts and the bottom video shows temperature anomaly forecasts.


Warmer temperatures over the Arctic have resulted in a slowdown of sea ice are growth, as illustrated by the image below (yellow line top left shows 2014 values).


Related posts

- Forecast: America to be hit by temperatures as low as minus 40 degrees
http://arctic-news.blogspot.com/2014/01/forecast-america-to-be-hit-by-temperatures-as-low-as-minus-40-degrees.html

- The Biggest Story of 2013
http://arctic-news.blogspot.com/2013/12/the-biggest-story-of-2013.html

- Polar jet stream appears hugely deformed
http://arctic-news.blogspot.com/2012/12/polar-jet-stream-appears-hugely-deformed.html


Tuesday, January 28, 2014

Methane Man


At the 2014 State of the Union address, President Obama said that the all-of-the-above energy strategy he announced a few years ago is working, describing natural gas as the bridge fuel that can power our economy.

Just do NOT tell them the monster exists
President Obama said: "Businesses plan to invest almost $100 billion in new factories that use natural gas. I’ll cut red tape to help states get those factories built, and this Congress can help by putting people to work building fueling stations that shift more cars and trucks from foreign oil to American natural gas."

President Obama added: "And when our children’s children look us in the eye and ask if we did all we could to leave them a safer, more stable world, with new sources of energy, I want us to be able to say yes, we did."

Methane levels going through the roof
Sadly, President Obama doesn't. President Obama missed yet another opportunity to articulate a plan to shift to genuinely clean energy, and instead chose to persist supporting all types of energy, in particular natural gas.

As the U.S. shifts to natural gas, more methane is entering the atmosphere. At the same time, methane eruptions from the seafloor of the Arctic Ocean continue to contribute to the temperature rises in the Arctic that are making the weather ever more extreme. The image below shows surface temperature anomalies above 20°C in the Arctic, while anomalies below -20°C feature at lower latitudes.


Saturday, January 11, 2014

Arctic in early January 2014

In early January 2014, Arctic sea ice extent reached levels as low as they were in early January 2013, as illustrated by the image below.


Methane levels over the Arctic remain extremely high. The image below shows methane readings for the period January 1 - 11, 2014, with the inset showing the situation in 2013 for the same period.


Similarly, the image below makes a comparison between methane recorded in 2013 and in 2014 for this period (January 1-11), this time focusing on the Arctic and only showing methane readings of 1950 ppb and higher in yellow.


Below a combination of images by Dr. Leonid Yurganov, also comparing methane levels between early 2013 and 2014. The difference isn't as marked in the image below as in the above image, as the highest value in the image below is 1920+ ppb, whereas the above image highlights levels of 1950+ ppb.


These high methane releases from the seafloor of the Arctic Ocean are contributing to the over 20°C temperature anomalies that have hit parts of the Arctic Ocean recently, as illustrated by the image below.

In conclusion, the Arctic is hit by three kinds of warming, while there are at least 13 feedbacks that further accelerate warming in the Arctic, as described in the post The Biggest Story of 2013.


Sunday, December 15, 2013

Methane emerges from warmer areas

As the year draws to a close, it's time to review where warming has occured most strongly in 2013. Surface temperature anomalies in November 2013 were 0.77°C, the highest global November anomalies on record. In November 2013, high temperature anomalies occurred in the Arctic, well over 9°C north and south of Novaya Zemlya.

Indeed, global warming is hitting the Arctic particularly hard, and some models have underestimated the pace at which this is occuring. Most heat goes into the oceans, which - due to the Gulf Stream - contributes to accelerated warming in the Arctic, where also less monitoring takes place than over land. Stefan Rahmstorf, Co-Chair of Earth System Analysis at the Potsdam Institute for Climate Impact Research, says at RealClimate:
A new study by British and Canadian researchers shows that the global temperature rise of the past 15 years has been greatly underestimated. The reason is the data gaps in the weather station network, especially in the Arctic. If you fill these data gaps using satellite measurements, the warming trend is more than doubled in the widely used HadCRUT4 data.
Where did warming occur most strongly in 2013? The red/orange areas on the image below shows surface temperature anomalies of more than 2°C for the year from December 13, 2012, to December 12, 2012.


As the image shows, temperature anomalies have hit Earth most strongly in the cryosphere, i.e.
- in Antarctica, as discussed at this post;
- on the Qinghai-Tibetan Plateau, as earlier discussed at this post;
- in the Arctic, as discussed below.

Over the past 90 days, the Arctic Ocean has shown surface temperature anomalies of over 5°C and in some spots over 8°C.


Looking at anomalies over longer periods can mask the occurrence of much higher anomalies on individual days. As an example, temperature anomalies of over 20°C were recorded over a large part of the Arctic Ocean on November 17, 2013. 


Baffin Bay, west of Greenland, has until now received little attention. High temperature anomalies over the past year show up on the top image. These high temperatures are the more striking given that a cold sea current runs through Baffin Bay, as shown on the image below. 
Methane has emerged strongly from areas that have warmed most in 2013. In August 2013, high concentrations of methane showed up over Siberia. High methane releases have further occurred in all three parts of the cryosphere mentioned above, i.e. from the heights of Antarctica, as discussed at this post, on the Qinghai-Tibetan Plateau, as earlier discussed at this post, and in the Arctic, as discussed in many posts at the Arctic-news blog.

Huge methane concentrations have featured over Baffin Bay recently. The animation below shows huge methane emissions emerging from Baffin Bay on December 2nd, 2013. The power behind these methane releases is strong enough to make it difficult for thicker ice to form in Baffin Bay. The animation below shows an area marked by a red rectangle where it looks like the water would have been covered with thicker ice, had there not been so much methane bubbling up in the area.


This area with very thin ice in Baffin Bay is further illustrated in the Naval Research Laboratory 30-day Arctic sea ice thickness animation below.


This constitues yet another feedback, i.e. methane bubbling up from the seafloor of the Arctic Ocean with a force strong enough to prevent sea ice from forming in the area. 


Thursday, November 28, 2013

Arctic Methane Impact

The image below covers a period of just over one day. On November 26, 2013, peak readings were as high as 2392 ppb.


The green circle highlights an area with high methane levels just north of Greenland. This methane likely originates from hydrates along the fault line that crosses the Arctic Ocean. As the Naval Research Laboratory animation below shows, sea ice in that area is rather thick. How it is possible for the methane to appear there? The answer must be, it seems, that there is so much movement in the sea ice in this area, that there are many cracks through which the methane can rise.


Above animation shows how a huge part of the sea ice, meters thick, is pushed along the edges of Greenland into the Atlantic Ocean, as a result of strong winds, as also illustrated by the animation below.


Methane has now been showing up prominently over the entire Arctic Ocean for more than a month and it doesn't look like this situation is coming to an end soon. The animation shows methane over the Arctic Ocean over a period of six days, with each frame covering a period of one day.


What is the impact of all this methane on temperatures over the Arctic? The NOAA image below shows surface temperature anomalies for a 30-day period.


When temperatures are averaged over longer periods, peaks will obviously show up less severe. Yet, on above image an area shows up in the Arctic where anomalies have averaged 15 degrees Celsius or more over this 30-day period.


When looking at individual days, anomalies of over 20 degrees Celsius can show up, on above image over quite a large area. While the weather can vary a lot and depends on a lot of factors, there is no doubt that the methane cloud hanging over the Arctic Ocean will have contributed to such anomalies. Since this methane isn't just going away soon, this spells bad news for what is ahead in the Arctic.


And while most efforts to contain global warming focus on ways to keep global temperature from rising with more than 2°C, a polynomial trendline already points at global temperature anomalies of 5°C by 2060. Even worse, a polynomial trend for the Arctic shows temperature anomalies of 4°C by 2020, 7°C by 2030 and 11°C by 2040, threatening to cause major feedbacks to kick in, including albedo changes and methane releases that will trigger runaway global warming that looks set to eventually catch up with accelerated warming in the Arctic and result in global temperature anomalies of 20°C+ by 2050.


Wednesday, October 30, 2013

Greenland Sea hit by M5.3 Earthquake

An earthquake with a magnitude of 5.3 on the Richter scale hit the Greenland Sea near Svalbard on October 28, 2013.

[ Earthquake indicated by orange dot - click on image to enlarge ]

For a long time, huge sea surface temperature anomalies have shown up in the area where the earthquake hit. The image below compares the situation before and after the earthquake hit.

[ click on image to enlarge ]

These huge sea surface temperature anomalies were discussed before, in the September 19, 2013, post Is the North Pole now ice-free?

This post mentions that sea surface temperatures in some spots close to Svalbard are far higher than even in the waters closer to the Atlantic Ocean. In some of these spots, sea surface temperatures are well over 10°C (50°F).

The post continues: Where does this heat come from? These hot spots could be caused by undersea volcanic activity; this is the more dangerous as this area has seen methane bubbling up from destabilized hydrates before; the dangers of this situation have been discussed repeatedly, e.g. in the April 2011 post Runaway Global Warming.

Indeed, the big danger is large abrupt release of methane from destabilized hydrates. At the moment, the amount of methane entering the atmosphere over the Arctic Ocean is already huge, as illustrated by the image below that shows high methane readings over the past few days.

[ click on image to enlarge ]

We'll keep monitoring the situation.

Saturday, September 21, 2013

High Methane Readings over Arctic Ocean

The image below shows a lot of methane over the Arctic Ocean on September 19, 2013 (pm).


Very worrying are the high methane readings close to Gakkel Ridge, the divergent fault line at the center of the Arctic Ocean, as earlier discussed in the post Methane Release caused by Earthquakes.

Furthermore very worrying are the high methane readings in between Greenland and Novaya Zemlya that coincide with high sea surface temperatures in that area. As discussed in the earlier post Is the North Pole no ice-free?, there are hot spots in the Arctic Ocean where sea surface temperatures are well over 10°C (50°F), which could be caused by undersea volcanic activity; this is the more dangerous as the area has seen methane bubbling up from destabilized hydrates.

For reference, images are added below of sea surface temperatures (top) and sea surface temperature anomalies (underneath) for September 19, 2013, showing sea surface temperatures recorded close to Svalbard that are far higher than even in the waters closer to the Atlantic Ocean.


Also for reference, highest mean and peak methane readings up to September 19, 2013, are added below.


Thursday, September 12, 2013

Temperature Rise

Surface Temperature Rise

How much have temperatures risen over the past 100 years or so? In the image below, Peter Carter points at the aerosols from volcanic eruptions and fossil fuel combustion that temporarily delay the full impact of global warming.


Temperature Rise hits Arctic most strongly

In above image, temperature anomalies are compared to a 3-decade base period from 1951 to 1980. To highlight the full wrath of global warming, it is more informative to compare anomalies with an earlier base period. Furthermore, a short running mean better shows how high peaks can reach.


NASA typically compares temperature change relative to 1951-1980, because the U.S. National Weather Service uses a three-decade period to define "normal" or average temperature. The NASA GISS analysis effort began around 1980, so the most recent 30 years at the time was 1951-1980.1

But as said, it is more informative to use a 30-year base period that starts earlier. To show Gobal & Arctic Temperature Change, James Hansen and Makiko Sato used a 1951-1980 base period next to a 1880-1920 base period. For this post, a 1883-1912 base period was selected to create the above image, and this same base period was selected to create the image below.


Above image shows that the Arctic is hit most strongly by the temperature rise. Note that the anomalies in above image are visualized by latitude, but are averaged by longitude globally, masking even higher anomalies that can be experienced at specific longitudes. At times, some areas in the Arctic do already experience anomalies of over 20°C, as shown in the animation below, based on NOAA data for the period December 7, 2011 - January 21, 2012.

[ Note: above animation is a 3MB file that may take some time to fully load ] 
Above animation was created by Sam Carana for the page Warming in the Arctic, which adds that the anomaly can be even more striking for individual days and locations. On January 6, 2011, the minimum temperature in Coral Harbour, located at the northwest corner of Hudson Bay in the province of Nunavut, Canada, was –3.7°C (25.3°F), i.e. 30°C (54°F) above average.2

The danger is that extreme weather events will cause waters in the Arctic Ocean to warm up, in turn causing heat to penetrate deep into the seabed and triggering destablization of methane held in the sediment in the form of hydrates or free gas. Ways for this to eventuate were also recently discussed in the post Arctic Ocean is turning red.3

Feedbacks

Feedbacks have the potential to dramatically speed up the temperature rise.


Albedo change, due to decline of snow and ice in the Arctic, exercizes a strong additional warming feedback. As illustrated by the above image by Neven, from the Arctic Sea Ice blog, average Arctic sea ice thickness (crudely calculated by dividing PIOMAS (PI) volume numbers with Cryosphere Today (CT) sea ice area numbers) is the lowest on record in the satellite era.


Another feedback is methane release. On August 25, 2013, mean global methane levels were recorded as high as 1828 ppb. On September 4, 2013, a peak methane level of 2481 ppb was recorded, showing how quickly methane levels can rise locally.


Runaway Global Warming

The danger is that, as sea ice retreats further and as methane traps more heat, there will be areas in the Arctic Ocean where cyclones will cause shallow waters to warm up all the way down to the seabed to such an extent that heat will penetrate the seabed, triggering destablization of methane held in the sediment in the form of hydrates and/or free gas. Recently, sea surface temperatures of about 20°C (68°F) were recorded in some spots in the Arctic Ocean, as also described the post Arctic Ocean is turning red.3

For more on the threat of runaway global warming, also see the methane hydrates blog.4  This situation calls for an effective and comprehensive climate plan, such as described at the ClimatePlan blog.5


Related

1. Four Hiroshima bombs a second: how we imagine climate change
Arctic-news.blogspot.com/2013/08/four-hiroshima-bombs-second-how-we-imagine-climate-change.html

2. Warming in the Arctic
Arctic-news.blogspot.com/p/warming-in-arctic.html

3. Arctic Ocean is turning red
Arctic-news.blogspot.com/2013/08/arctic-ocean-is-turning-red.html

4. Methane hydrates
Methane-hydrates.blogspot.com/2013/04/methane-hydrates.html

5. Climate Plan
ClimatePlan.blogspot.com/2013/01/an-effective-and-comprehensive-climate-plan.html

Monday, March 18, 2013

Huge patches of warm air over the Arctic

Over the past month or so, huge patches with temperature anomalies of over 20 degrees Celsius have been forming over the Arctic.

The three images below show such patches stretch out from Svalbard to Novaya Zemlya (top), north of Eastern Siberia (middle) and over West Greenland and Baffin Bay (bottom).


How these patches with warm air developed is further illustrated by the animation below, which goes from February 12, 2013, to March 18, 2013.


This is a 2.3 MB file that may take some time to fully load. 

Paul Beckwith, regular contributor to the Arctic-news blog, comments:
Paul Beckwith,
B.Eng, M.Sc. (Physics),
Ph.D. student (Climatology)
and Part-time Professor,
University of Ottawa
 

"The problem with this type of pattern is that there is a tendency for what is termed the AD (Arctic Dipole) consisting of exceptionally high pressures over Northern Canada to Greenland. When the air leaves this region heading for the low pressure regions (winds) it curves to the right (due to Coriolis force) and is thus driven from the Bering Strait region to the North Pole and then out Fram Strait, this conduit is like flushing the toilet on the ice. Warm water is pulled to the cold North Pole and the ice is driven out the Fram Strait into the warm Atlantic where it is melted."

"But the really big problem is that this high pressure area over Northern Canada is a ridge (blocking) that stays pretty stationary over the summers and is directly causing the heat waves and drought in the western US (2003, 2011, 2012). Another really big problem is that the part of the ridge over Greenland (or large GBI = Greenland Blocking Index); as discussed by Overland, Francis, et. al. in 2012 causes excessive melt in Greenland (as we saw in July, 2012 when 97% of Greenland was melting on the surface instead of the usual 40%). This is sending the Greenland albedo into a steep drop, causing even more heat absorption and melting."

To illustrate this further, Paul adds the animation below, from weather.unisys.com.

This animation is a 1 MB file that may take some time to fully load
Paul adds: "The Greenland high could reach 1070 mb in next few days; that will bring huge temperatures! By comparison, the world record highest was 1085 in Mongolia in December 19, 2001".

The 1070 mb high over Greenland is further illustrated by the image below, from weather.unisys.com.


Indeed, as the jet stream slows down and becomes more wavier, such patches of warm air can be expected to extend more regularly into the Arctic. The result can be a huge melt of Arctic sea ice, as well as a huge melt of snow cover in Greenland, which also dramatically lowers albedo, as occurred in 2012 and as discussed in the earlier post Greenland is melting at incredible rate.

This spells bad news for the Arctic sea ice, which may well disappear altogether this summer.

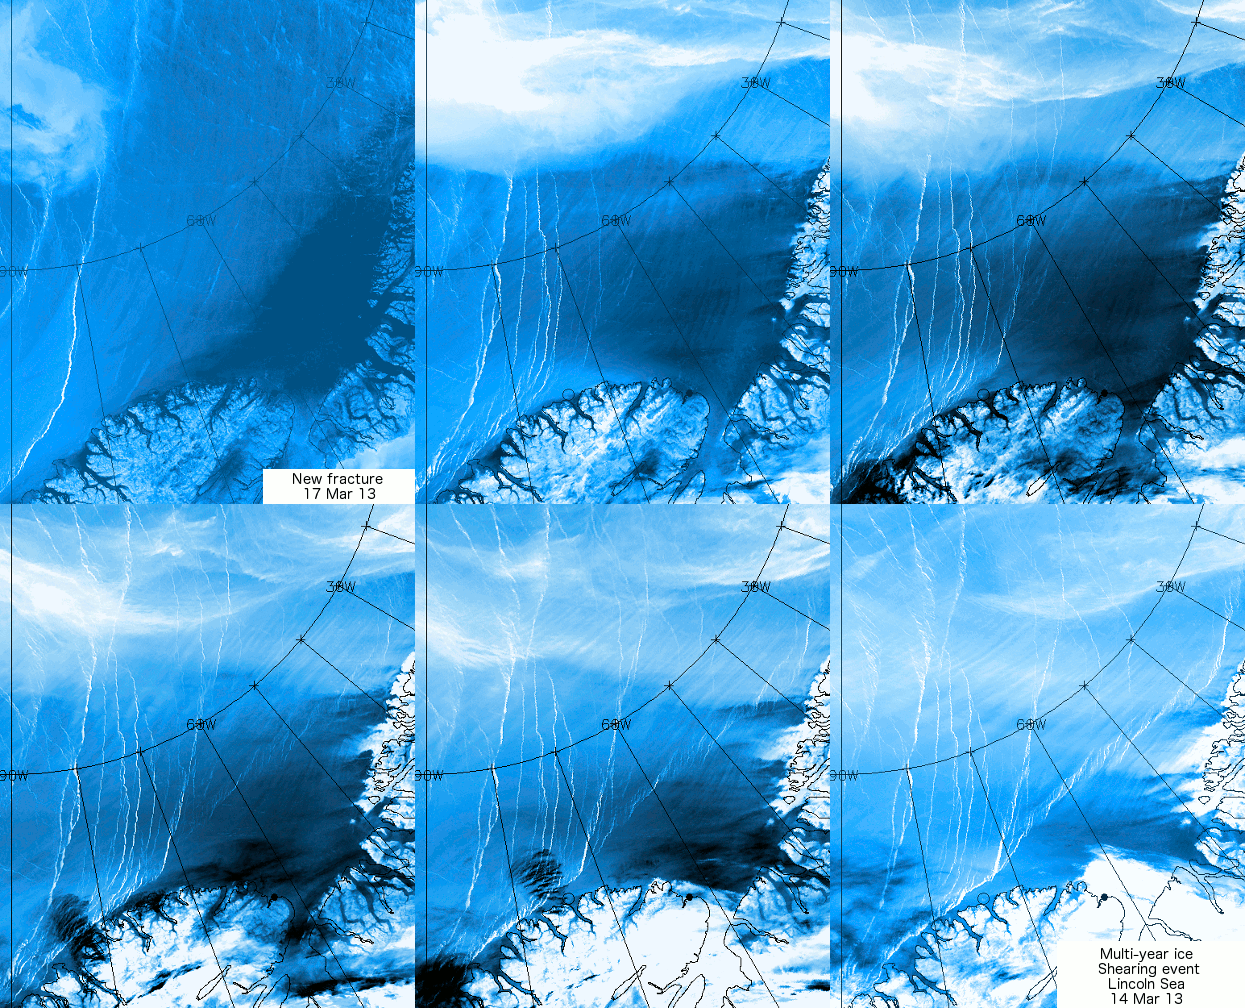
Paul further adds: "For the record; I do not think that any sea ice will survive this summer. An event unprecedented in human history is today, this very moment, transpiring in the Arctic Ocean. The cracks in the sea ice that I reported on my Sierra Club Canada blog and elsewhere over the last several days have spread and at this moment the entire sea ice sheet (or about 99% of it) covering the Arctic Ocean is on the move. Clockwise. The ice is thin, and slushy, and breaking apart."

"This is abrupt climate change in real-time. Humans have benefitted greatly from a stable climate for the last 11,000 years or roughly 400 generations. Not any more. We now face an angry climate. One that we have poked in the eye with our fossil fuel stick and awakened. And now we must deal with the consequences. We must set aside our differences and prepare for what we can no longer avoid. And that is massive disruption to our civilizations."

The animation below, from genomewiki.ucsc.edu shows cracks in the sea ice with the Wikipedia image underneath showing the location.


Related posts

- Polar jet stream appears hugely deformed
- Hurricane Sandy moving inland