Showing posts with label current. Show all posts

Wednesday, January 8, 2014

High Methane Levels over Arctic Ocean continue in 2014

The high methane levels over the Arctic Ocean, the biggest story of 2013, continue in 2014, as illustrated by the image below.


As above image shows, high methane readings (as high as 2301 ppb on January 6, 2014) continue in 2014. High methane concentrations continue to enter the atmosphere where the sea ice is thin and where the sea ice is carried by currents outside of the Arctic Ocean.

The inset shows ice thickness on January 6, 2014. The inset highlights the huge amounts of sea ice that are carried by the sea current from the north of Greenland into the Atlantic Ocean.

What is the impact of these high methane releases over the Arctic Ocean on global methane levels? The image below shows the most recent global methane levels available from NOAA.


The image below shows readings from surface flask at Mauno Loa, Hawaii, with two recent readings (in the top right corner) reaching levels close to 1880 ppb.


Clearly, methane levels are rising globally and high releases over the Arctic Ocean are contributing to the global rise. The images below show recent data from stations in the Arctic, i.e. the image below showing readings from in situ measurements at the station at Barrow, Alaska, and the image further below showing flask samples taken at Tiksi, Russia.


Note that the above images reflect land-based measurements taken at altitudes that are typically too low to capture the extent at which methane is rising in the atmosphere over the Arctic Ocean. Nonetheless, the wind can at times carry along some of the methane from the Arctic Ocean, as is apparent in a number of readings in above images showing levels of over 2100 ppb.

The image below shows high methane releases over the Arctic Ocean, as recorded on (part of) January 7, 2014, when levels were reached as high as 2381 ppb.


The image below shows methane levels on (part of) January 8, 2014, when levels as high as 2341 ppb were recorded. The inset confirms indications that these high levels originate from the Arctic Ocean.


These high methane concentrations over the Arctic are contributing to high temperature anomalies that further accelerate warming in the Arctic, as illustrated by the image below.


For a more detailed description of the kinds of warming and feedbacks that are hitting the Arctic, see the post The Biggest Story of 2013.


Thursday, December 26, 2013

Sea Ice in decline between Svalbard and Greenland

[ click on image to enlarge ]
Above image shows that Earth's highest atmospheric methane concentrations are recorded over the Arctic Ocean. The insets show lower methane concentrations over various continents, North and South America (top left), Europe (mid right), Australia bottom left) and Antarctica (bottom right).

The top right inset shows sea ice thickness, illustrating that methane is escaping from the sea floor of the Arctic Ocean and is transported by currents to the thinner edges of the sea ice, where it is entering the atmosphere.

As discussed in a recent post, methane can be bubbling up in the Arctic Ocean with a force strong enough to prevent sea ice from forming in the area. This feedback is depicted in the Diagram of Doom further below as feedback #13.


Around this time of year, Arctic sea ice is typically growing rapidly, both in extent and thickness.

However, the above image shows that in the area marked by the white circle, between Svalbard and Greenland, the sea ice is actually in decline.

[ click on image to enlarge ]
This decline is caused by methane that is entering the atmosphere in the area as warmer water continues to be transported by the Gulf Stream into the Arctic Ocean, as discussed in previous posts such as this one, and as also illustrated by the image on the right.

Warmer than average waters have been entering the Arctic Ocean along the Gulf Stream since July 2013, when changes to the Jet Stream contributed to waters off the North American coast reaching record warmest temperatures, as depicted in the Diagram of Doom below as feedback #11.

In summary, the above images show that methane makes it hard for ice to form, while the warm water of the West Spitzbergen Current is pushing the ice away, breaking up even the thickest ice to the north of Greenland.

Surface temperatures in the area have been extremely high recently. This part of the Arctic Ocean was hit by an 18+°C anomaly during the week from December 16 to December 22, 2013, as illustrated by the image below.


On some days that week, anomalies of 20+°C were recorded over an even larger part of the Arctic Ocean, as described in a previous post. These anomalies show how a number of feedbacks can interact and contribute to huge warming peaks in the Arctic Ocean, such as methane releases (feedbacks #2 and #13 in the diagram below) and changes to the Jet Stream (feedbacks #10 and #11 in the diagram below).

This spells bad news for the sea ice. Some people may have hoped that the thicker sea ice north of Greenland would take decades to disappear. However, as depicted in the Diagram of Doom below, feedbacks can hugely accelerate sea ice decline. As sea ice declines further, more open water make it more likely that stronger storms and cyclones will appear that can rip the sea ice apart and move the pieces into the Atlantic Ocean in a matter of days.

The image below, by Jim Pettit, illustrates the ongoing decline of the sea ice.


Thirteen feedbacks that can accelerate warming in the Arctic are depicted in the diagram below.


Specific feedbacks are described in the following posts:
- Diagram of Doom
- Further feedbacks of sea ice decline in the Arctic
- Causes of high methane levels over Arctic Ocean
- Methane Release caused by Earthquakes
- How Do We Act in the Face of Climate Chaos?
- The astounding global warming impact on our oceans . . .
- Methane emerges from warmer areas
Feedbacks are pictured in a more general way in the image below.


Above image shows how the accumulation of the many feedbacks and their interaction leads to ever stronger albedo changes, while the resulting accelerated warming in the Arctic causes increasing quantities of methane to be released from the seafloor of the Arctic Ocean, in turn leading to runaway global warming, as also pictured in the image below.

[ click on image to enlarge ]
As above image shows, a polynomial trendline already points at global temperature anomalies of 5°C by 2060. Even worse, a polynomial trendline for the Arctic shows temperature anomalies of 4°C by 2020, 7°C by 2030 and 11°C by 2040, threatening to cause major feedbacks to kick in, including albedo changes and methane releases that will trigger runaway global warming that looks set to eventually catch up with accelerated warming in the Arctic and result in global temperature anomalies of 20°C+ by 2050.

To reduce these risks, comprehensive and effective action is needed, such as described at the Climate Plan blog.

Thursday, October 31, 2013

Causes of high methane levels over Arctic Ocean

Methane levels in the atmosphere over the Arctic Ocean are very high, as illustrated by the image below, by Leonid Yurganov, showing IASI methane readings for October 11-20, 2013.


Previous posts have discussed these high levels of methane, pointing at links between high methane levels over Arctic Ocean and earthquakes and volcanic activity.

Malcolm Light points at another factor that is contributing to the high methane levels observed over the Arctic Ocean in October 2013.

Malcolm says: The massive methane release in the Arctic this October is partly because the Gulf Stream waters got massive heating in the Atlantic off the North American coast in July. It takes the Gulf Stream currents almost 4 months to reach the emission sites along the southern side and end of the Eurasian Basin. This combined with the earthquake activity along the Gakkel Ridge and deep pyroclastic eruptions is escalating the rate of methane release by destabilizing the submarine Arctic methane hydrates at increasing rates.

The NOAA image below shows temperature anomalies for July 2013. NOAA adds that in July 2013 many regions were much warmer than average, with part of the northeastern Atlantic off the coast of North America observing record warmth.


The image below shows how water traveling along the Gulf Stream ends up in the Arctic Ocean. Water in the Gulf Stream travels at 4 miles per hour, but slows down to less than 1 mile per hour in the North-Atlantic Current. This means that water warmed up off Florida in July will start reaching waters beyond Svalbard in October.


The image below, from Malcolm Light's September 2012 post Further Confirmation of a Probable Arctic Sea Ice Loss by Late 2015, shows how warm water flows into the Arctic Ocean and warms up methane hydrates and free gas held in sediments under the Arctic Ocean.
 The image below shows the methane readings over the past few days on the Northern Hemisphere.


Tuesday, August 28, 2012

Diagram of Doom


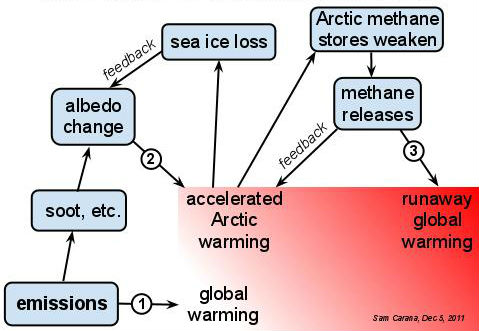
Above diagram was part of a poster displayed at the 2011 AGU meeting in San Francisco by the Arctic Methane Emergency Group (AMEG). It was accompanied by the following text: In the Arctic, three problems are compounding one another: emissions causing global warming, sea ice loss causing accelerated warming, and methane releases further accelerating Arctic warming, with the danger of triggering runaway global warming.

The diagram pictures three kinds of warming and their main causes:
  1. Emissions by people causing global warming, with temperatures rising around the globe, including the Arctic.
  2. Soot, dust and volatile organic compounds settling down on snow and ice, causing albedo change. More heat is absorbed, rather than reflected as was previously the case. This causes accelerated warming in the Arctic.
  3. Accelerated warming in the Arctic threatening to weaken methane stores in the Arctic with the danger that methane releases will trigger runaway global warming.

The diagram also pictures two feedback effects that make things even worse:
  • Albedo feedback: Accelerated warming in the Arctic speeds up sea ice loss, further accelerating albedo change.
  • Methane feedback: Methane releases in the Arctic further add to the acceleration of warming in the Arctic, further contributing to weaken Arctic methane stores and increasing the danger that methane releases will trigger runaway global warming.

Albedo change in the Arctic comprises a number of elements, as depicted in the image below, from the 2004 report Impacts of a Warming Arctic - Arctic Climate Impact Assessmentby the International Arctic Science Committee.  


As described in various posts at this blog over time, there are further points that should be taken into account. Regarding sea ice loss, it's clear that where sea ice retreats, more open water appears, with the result that less sunlight is reflected back into space. Accelerated warming will also affect the integrity of the remaining sea ice, as well as of the snow and ice cover on land, including glaciers. This further adds to the albedo effect, causing less sunlight to be reflected back into space. Similarly, further feedbacks could be added or described in more detail.

Accordingly, ten feedbacks can be identified, and described as follows:
  1. Albedo feedback: Accelerated warming in the Arctic speeds up the decline of ice and snow cover, further accelerating albedo change. 
  2. Methane feedback: Methane releases in the Arctic further add to the acceleration of warming in the Arctic, further contributing to weaken Arctic methane stores and increasing the danger that methane releases will trigger runaway global warming. 
  3. Currents feedback: Sea ice loss can cause vertical sea currents to weaken, reducing the cooling effect they had on the seabed. This can thus further cause sediments to warm up that can contain huge amounts of methane in the form of free gas and hydrates. 
  4. Storms feedback: Increased frequency and intensity of storms can cause substantially more vertical mixing of the sea water column, causing more warming of the seabed, thus further contributing to the warming of sediments, as above. 
  5. Storms feedback: Accelerated warming in the Arctic can result in more storms, causing mixing of cold Arctic air with warmer air from outside the Arctic. The net result is a warmer Arctic. 
  6. Storms feedback: More open waters can result in more storms that can push the ice across the Arctic Ocean, and possibly all the way out of the Arctic Ocean. 
  7. Storms feedback: Storms also cause more waves that break up the sea ice. Smaller pieces of ice melt quicker than large pieces. A large flat and solid layer of ice is also less susceptible to wind than many lighter and smaller pieces of ice that will stand out above the water and capture the wind like the sails of yachts. 
  8. Storms feedback: Storms cause waters to become more wavy. Calm waters can reflect much sunlight back into space, acting as a mirror, especially when the sun shines under a low angle. Wavy waters, on the other hand, absorb more sunlight. 
  9. Fires feedback: More extreme weather comes with heatwaves and storms. Thus, this is in part another storms feedback. The combination of storms and fires can be deadly. Heatwaves can spark fires that, when fueled up by storms, turn into firestorms affecting huge areas and causing huge amounts of emissions. Storms can whip up particles that when deposited on ice, snow or the bare soil, can cause more sunlight to be absorbed. 
  10. Open doors feedback: Accelerated warming in the Arctic causes the polar vortex and jet stream to weaken, causing more extreme weather and making it easier for warm air to enter the Arctic.

These ten feedback are depicted in the diagram below.