Showing posts with label volume. Show all posts

Monday, March 10, 2014

M4.5 Earthquake hits Gakkel Ridge


The above image shows recent large methane release over the Gakkel Ridge, the faultline that crosses the Arctic Ocean between the northern tip of Greenland and the Laptev Sea (red line on map). Methane readings were as high as 2395 ppb at 586 mb, an altitude that often shows high methane readings originating from the Arctic Ocean.

An earthquake with a magnitude of 4.5 hit the Gakkel Ridge at a depth of 2 km on March 6, 2014, at 11:17.17.0 UTC. The location is shown on the map below.

[ click on image to enlarge ]
The image below shows more recent methane readings, around March 8, 2014.


The image below is a Naval Research Laboratory forecast of sea ice thickness for March 8, 2014, run on March 3, 2014.


Meanwhile, the sea ice is close to record lows (for the time of the year), as illustrated by the images below. The image directly below shows sea ice area.


The image below shows sea ice extent.


The image below, by Wipneus, shows sea ice volume.
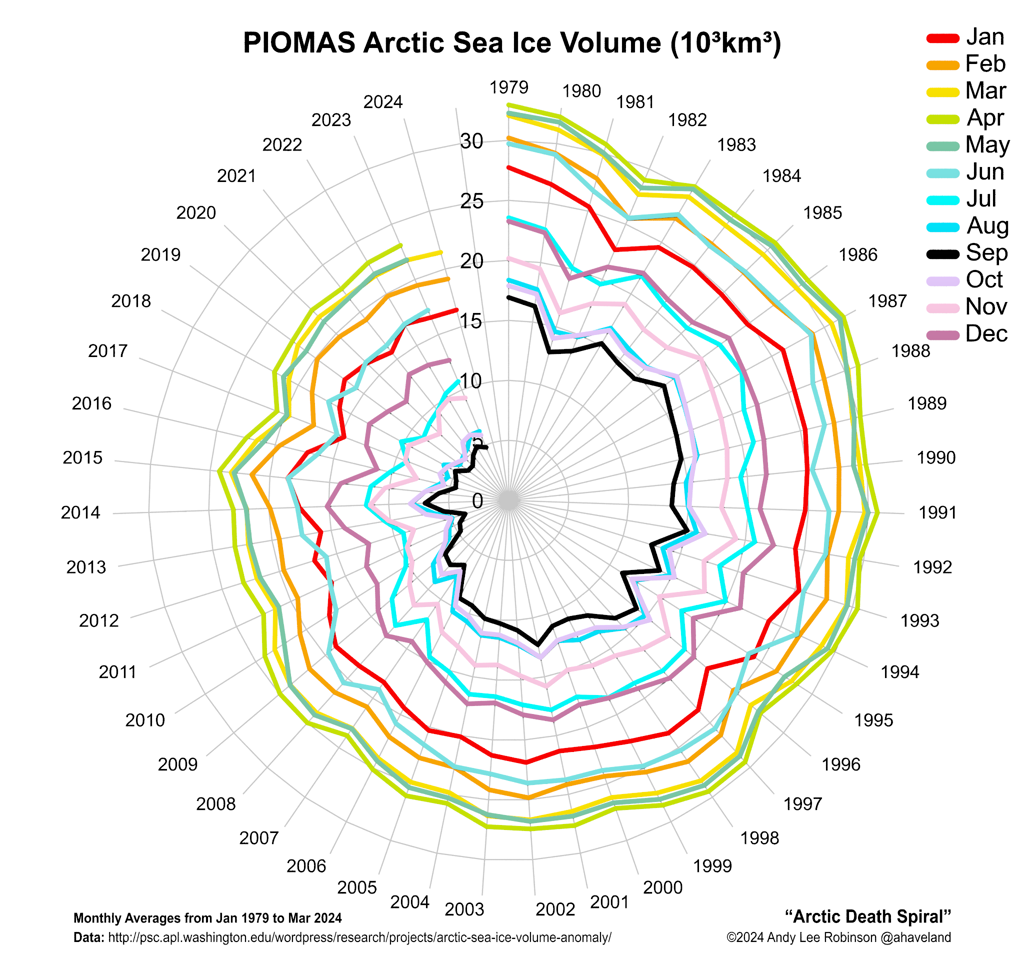
The image below, by Andy Lee Robinson, offers a different way of looking at sea ice volume, the Arctic Death Spiral.


Thursday, September 19, 2013

Is the North Pole now ice-free?

Is the North Pole now ice-free? It could well be that, by the time you read this, there will be no ice left at all at the North Pole. The image below, created by Sam Carana from a nowcast from the Naval Research Laboratory, run on September 17, 2013 and valid for September 18, 2013, shows open water extending all the way to a spot very close to the North Pole.


As the color indicates, sea ice thickness in this area is virtually zero (i.e. ice-free). This development of an ice-free area at the North Pole has been discussed in earlier posts such as:
  • Arctic sea ice thickness falls by 2m in 21 days in some areas (June 13, 2013)
  • Open Water In Areas Around North Pole (June 22, 2013), describing areas around the North Pole where sea ice thickness had fallen to virtually zero, i.e. open water. 
  • Open Water at North Pole (July 22, 2013), descibing a wide corridor that had developed with very thin ice between the North Pole and Siberia. The post added that surface water on top of this thin ice could extend along this corridor, all the way from the North Pole to edge of the ice, in which case the surface water effectively becomes part of open water.
  • North Hole (September 2, 2013), describing areas close to the North Pole where ice volume had fallen to virtually zero, while pointing at how devastating the impact of sea surface temperature anomalies can be. 
This sea ice thinning in areas close to the North Pole has been one of the most important developments in 2013. Yet, many people keep watching sea ice extent.

Why was Arctic sea ice not smaller in extent in 2013 than in 2012?

The comparison below shows both volume and the extent of the sea ice for the same day in 2013 (left), respectively 2012 (right). Natural variability can make Arctic sea ice slightly smaller or larger than projected. There are many factors that influence things from year to year, such as weather conditions, sea currents and temperatures of the water in the Atlantic and Pacific Oceans; some factors are discussed in more detail below.


The above comparison shows a lot more ice north of Alaska in 2013 (above left) than in 2012 (above right). The comparison below shows that salinity levels in the Beaufort Sea were lower in 2013 (below left) than in 2012 (below right).


Seawater typically has a salinity level of over 3%; it freezes at about −2°C (28°F). Where mixing occurs with fresh water runoff from melting glaciers and permafrost, the water in the Arctic Ocean can become substantially less saline. Other substances added to the water, such as sand, can also cause a freezing point drop. The freezing and melting point of fresh water (i.e. zero salinity) is 0°C (or 32°F).  Less salinity means the water will remain frozen until the temperature reaches levels closer to 0°C.

Thinning continues

Heatwave conditions in Alaska caused greater melting of the permafrost. The result was more fresh water run-off through the MacKenzie River into the Beaufort Sea. This has contributed to keep sea ice extent larger in 2013. Yet, the warm water has also contributed to further thinning of the ice, reinforcing warnings that the sea ice looks set to disappear altogether within years. 


As illustrated by the above image by Neven, from the Arctic Sea Ice blog, average Arctic sea ice thickness (crudely calculated by dividing PIOMAS (PI) volume numbers with Cryosphere Today (CT) sea ice area numbers) has been very low in 2013.

The image below shows that annual minimum volumes appear to follow an exponential trend downward to zero, firstly reached in September 2015, followed by zero ice in the surrounding months over subsequent years.

Some people have objected against using PIOMAS data for such projections, with arguments ranging from suggestions that PIOMAS data were not reliable, that natural variability could prove such projections to be wrong, to questioning whether an exponential trend was appropriate. Nonetheless, it seems that over the years arguments in favor of an exponential trend have only become stronger:
  • Further measurements such as by CryoSat have confirmed that the PIOMAS data are indeed reliable and that the sea ice decline may well be even more dramatic. 
  • Natural variability goes both ways, it can either speed up or slow down ice melt. Had there been less runoff from the MacKenzie River, the sea ice in 2013 may not have been able to refreeze after being hit by cyclones several times. Next year we may not be so lucky and sea ice could disappear altogether, due to natural variability.  
  • Thick ice along the northern coast of Greenland is indeeed more persistent because of on-shore winds that cause the ice to drift and pile-up there. This would favor a Gompertz (or Sigmoid) trend in extrapolations (see image on the right). However, the new development of an ice-free North Pole shows that the sea ice is capable of breaking up abruptly, not only from the outer edges toward Greenland, but also starting at the North Pole and even moving from there toward Greenland. Moreover, as the 30-day animation below shows, thick sea ice north of Greenland can thin very quickly, suggesting it could well disappear altogether within one season.  


Sea ice can thin rapidly, even when it is multiple meters thick 

Earlier in 2013, much warm water entered the Arctic Ocean from the mouths of rivers, as discussed in the post Arctic Ocean is turning red. As said, this resulted in lower salinity levels in the Beaufort Sea that prevented cyclones from demolishing the sea ice altogether. Nonetheless, the joint impact of cyclones and warm water does appear to have caused rapid decline of the thick ice north of Greenland and Canada, as earlier discussed in an earlier post. 

Furthermore, sea surface temperatures have been recorded close to Svalbard that are far higher than even in the waters closer to the Atlantic Ocean. This phenomenon is illustrated by the image below, showing sea surface temperatures (top) and sea surface temperature anomalies (underneath). 


In some of these spots, sea surface temperatures are well over 10°C (50°F). Where does this heat come from? 

These hot spots could be caused by undersea volcanic activity; this is the more dangerous as the area has seen methane bubbling up from hydrates that have become destabilized; such dangers have been discussed repeatedly, e.g. in the post Runaway Global Warming. Hot spots can also contribute to even more dramatic thinning of the sea ice, including the thickest parts. 

In conclusion, there is no reason to assume that the sea ice in the Arctic will somehow magically recover. Instead, there are many indications that exponential decline of Arctic sea ice will continue. Less salinity may have temporarily prolonged the extent of the sea ice in some areas, but as sea surface temperatures keep rising, the ever thinner ice looks set to collapse within years, with dire consequences. This calls for comprehensive and effective action, such as described at the ClimatePlan blog.  


Related posts

- Arctic sea ice thickness falls by 2m in 21 days in some areas
Arctic-news.blogspot.com/2013/06/arctic-sea-ice-thickness-falls-by-2m-in-21-days-in-some-areas.html

- Open Water In Areas Around North Pole
Arctic-news.blogspot.com/2013/06/open-water-in-areas-around-north-pole.html

- Open Water at North Pole
Arctic-news.blogspot.com/2013/07/open-water-at-north-pole.html

- North Hole
Arctic-news.blogspot.com/2013/09/north-hole.html

- CryoSat - New Dimensions on Ice
esa.int/Our_Activities/Observing_the_Earth/Living_Planet_Symposium_2013/New_dimensions_on_ice

- Arctic Ocean is turning red
Arctic-news.blogspot.com/2013/08/arctic-ocean-is-turning-red.html

- Cyclone raging on thin ice
Arctic-news.blogspot.com/2013/08/cyclone-raging-on-thin-ice.html

- Runaway Global Warming
Geo-engineering.blogspot.com/2011/04/runaway-global-warming.html

- Climate Plan
ClimatePlan.blogspot.com

Monday, September 2, 2013

North Hole

Sea Surface Temperature Anomalies

A dust storm approaches Stratford, Texas, in 1935. From: Wikipedia: Dust Bowl
During the 1930s, North America experienced a devastating drought affecting almost two-thirds of the United States as well as parts of Mexico and Canada. The period is referred to as the Dust Bowl, for its numerous dust storms.

Rapid creation of farms and use of gasoline tractors had caused erosion at massive scale.

Extensive deep plowing of the virgin topsoil of the Great Plains in the preceding decade had removed the natural deep-rooted vegetation that previously kept the soil in place and trapped moisture even during periods of drought and high winds.

So, when the drought came, the dust storms emerged.  But what caused the drought?

A 2004 study concludes that the drought was caused by anomalous tropical sea surface temperatures (SST) during that decade and that interactions between the atmosphere and the land surface increased its severity (see image above right with SST anomalies).

Sea Surface Temperature Anomalies in the Arctic

As the above chart shows, SST anomalies in the days of the Dust Bowl were not greater than one degree Celsius. It is in this context that the current situation in the Arctic must be seen. This year, SST anomalies of 5 degrees Celsius or more are showing up in virtually all areas in the Arctic Ocean where the sea ice has disappeared; some areas are exposed to sea surface temperature anomalies higher than 8°C (14.4°F), as discussed in the post Arctic Ocean is turning red.

High SST anomalies can change weather patterns in many places, as discussed in an earlier post on changes to the Polar Jet Stream. The world is now stumbling from one extreme weather event into another, and things look set to get worse every year.

Feedbacks in many ways make things even worse in the Arctic, as described in the post Diagram of Doom. A recent paper by Feng et al. notes that river runoff has significantly increased across the Eurasian Arctic in recent decades, resulting in increased export of young surface carbon. In addition, the paper says, climate change-induced mobilization of old permafrost carbon is well underway in the Arctic. An earlier paper already warned about coastal erosion due to the permafrost melt. In conclusion, the Arctic is hit by climate change like no other place on Earth.

North Hole

As the ice thickness map below shows, holes have appeared in the sea ice in places that once were covered by thick multi-year sea ice.


One such hole, for its proximity to the North Pole, has been aptly named the "North Hole". On the sea ice concentration map below, this hole shows up as a blue spot (i.e. zero ice).


The "Methane Catastrophe"

Why do we care? For starters, methane appears to be rising up from these holes in the sea ice, forming a cloud of high methane concentrations over the Arctic Ocean.


Perhaps this is a good occasion to again look at the methane plume over one km in diameter that appeared in the Laptev Sea end September 2011. The image is part of a paper on the unfolding "Methane Catastrophe".


Back in 2008, Shakhova et al., in the study Anomalies of methane in the atmosphere over the East Siberian shelf: Is there any sign of methane leakage from shallow shelf hydrates? considered release of up to 50 Gt of predicted amount of hydrate storage as highly possible for abrupt release at any time.

For more on the methane threat, please read the post methane hydrates or view the FAQ page.

Action 

The threat of the "Methane Catastrophe" requires action to be taken urgently, such as discussed at this ClimatePlan.


Thursday, August 15, 2013

Arctic Sea Ice in Free Fall

Arctic Sea Ice has declined dramatically recently. The recent image below, by the Danish Meteorological Institute, shows the decline in extent over the past few days, with extent calculated by including all areas with ice concentration higher than 30%.


As the above image shows, sea ice extent (30%+ concentration) is now lower than any other year, except 2007 and 2012. Moreover, the sharp decline looks set to continue.

Ice volume and concentration have dropped dramatically, partly as a result of the cyclone that hit the Arctic Ocean a few days ago. The eye of the cyclone is still visible almost exactly above the North Pole on the Naval Research Laboratory image below on the right, where sea ice concentration appears to form a circle.

The sea ice looks set for an all-time record low; all this thin ice looks set to disappear over the next few weeks.

The graph below, also by the Danish Meteorological Institute, calculates sea ice extent by including all areas with 15% or more ice concentration.
The above graph also shows a steep recent descent, although not as pronounced as in the graph at the top that includes spots with 30% or more ice concentration. The graph at the top better illustrates recent drops in ice concentration from, say, 40% to 20%, which can occur quite abruptly due to the impact of a cyclone. 

The Danish Meteorological Institute has meanwhile produced a more recent version of the graph based on spots with 30% or more ice concentration (added below).


The above graph shows an August 15 extent that appears to be back in line with the earlier trend. At first glance, it may appear as if the sea ice has largely recovered from the impact of three cyclones that have hit the Arctic Ocean over the past two months. 

However, these cyclones are likely to have contributed to the appearance and persistence of thin spots in the ice close to the North Pole. This phenomenon was earlier described in posts such as Thin Spots developing in Arctic Sea Ice. 

The conclusion remains the same as the one drawn then in that post, i.e. that for years, observation-based projections have been warning about Arctic sea ice collapse within years, with dire consequences for the Arctic and for the world at large.

Cyclones can speed up this collapse. On this point, it's good to remember what Prof. Peter Wadhams said in 2012:
". . apart from melting, strong winds can also influence sea ice extent, as happened in 2007 when much ice was driven across the Arctic Ocean by southerly winds (not northerly, as she stated). The fact that this occurred can only lead us to conclude that this could happen again. Natural variability offers no reason to rule out such a collapse, since natural variability works both ways, it could bring about such a collapse either earlier or later than models indicate.

In fact, the thinner the sea ice gets, the more likely an early collapse is to occur. It is accepted science that global warming will increase the intensity of extreme weather events, so more heavy winds and more intense storms can be expected to increasingly break up the remaining ice, both mechanically and by enhancing ocean heat transfer to the under-ice surface."
Hopefully, more people will realize the urgency of the situation and realize the need for a comprehensive and effective plan of action as described here.

Tuesday, August 13, 2013

Arctic Death Spiral - Evolution to July 2013

Image by Andy Lee Robinson, from http://haveland.com/share/arctic-death-spiral.png
The video below is a visualization of the Arctic Death Spiral showing the evolution of the volume of sea-ice over time from 1979 to July 2013.

The rate of ice loss in the Arctic is staggering. Since 1979, the volume of Summer Arctic sea ice has declined by more than 80% and is accelerating faster than scientists believed it would, or even could melt.


Pitch of the notes are proportional to the average sea-ice volume for each month. Spectral filters are derived from the average sea-ice volume for each year. Produced using Perl and PovRay, Midi perl and Reason and Virtualdub on a cluster of Linux servers.


Above image is another way to visualize the data. It is a screenshot from the video below, by Andy Lee Robinson, illustrating the dramatic decline since 1979 until July 2013.

Andy Lee Robinson
The soundtrack "Arctic Requiem" also by Andy Lee Robinson, is available for free download: http://haveland.com/share/Arctic-Requiem.mp3

Sea Ice Volume is calculated using the Pan-Arctic Ice Ocean Modeling and Assimilation System (PIOMAS, Zhang and Rothrock, 2003) developed at APL/PSC.

Source data is available from:
http://psc.apl.washington.edu/wordpress/research/projects/arctic-sea-ice-volume-anomaly/


Monday, August 12, 2013

Cyclone raging on Thin Ice

Another cyclone is raging over the Arctic Ocean. The Naval Research Laboratory image below shows the speed and drift of the sea ice.

[ click on image to enlarge ]
Last time a cyclone hit the Arctic, this resulted in a temporary increase in area covered by sea ice, as shown on the Cryosphere Today image below. The cyclone pushed down on the sea ice, flattening it and pushing it sideways. 


Note that area as measured by the Cryosphere Today includes all spots that have a 15% or higher concentration of ice. This way of measuring area ignores the fact that the cyclone reduced the sea ice concentration in many spots, from a high sea ice concentration (around 90%) to a lower concentration (less than 80%), as shown on the Naval Research Laboratory image below. 


Furthermore, sea ice has since dropped in thickness, as illustrated by the Naval Research Laboratory image below. 

Much of the ice is now less than one meter thick, while some areas close to the North Pole have ice that is only between zero and half a meter thick.

The cyclone is raging most fiercely in those areas and much of the ice is drifting out into the Atlantic Ocean.

Neven mentioned at the Arctic Sea Ice Blog that average thickness (crudely calculated by dividing PIOMAS (PI) volume numbers with Cryosphere Today (CT) sea ice area numbers, see image below) had a very steep drop in July, similar to the drop in 2010. This year's trend line is now lowest, probably signifying that the ice pack is spread out and thin at the edges (read: melting potential).

[ click on image to enlarge ]
The image below, from the University of Bremen, Germany, shows sea ice concentration on August 11, 2013.


Saturday, June 22, 2013

Open Water In Areas Around North Pole

In some areas around the North Pole, thickness of the sea ice has declined to virtually zero, i.e. open water.


What could have caused this open water? Let's go through some of the background.

North Hemisphere snow cover has been low for some time. Snow cover in May 2013 was the lowest on record for Eurasia. There now is very little snow left, as shown on the image right, adapted from the National Ice Center.

Low snow cover is causing more sunlight to be absorbed, rather than reflected back into space. As can be expected, there now are high surface temperatures in many areas, as illustrated by the NOAA image below. Anomalies can be very high in specific cases. Zyryanka, Siberia, recently recorded a high of 37.4 C, against normal high temperatures of 20 C to 21 C for this time of year. Heat wave conditions were also recorded in Alaska recently (satellite image of Alaska below).

NASA image June 17, 2013, credit: NASA/Jeff Schmaltz, LANCE MODIS Rapid Response Team, NASA GSFC - from caption by Adam Voiland: "Talkeetna, a town about 100 miles north of Anchorage, saw temperatures reach 96°F (36°C) on June 17. Other towns in southern Alaska set all-time record highs, including Cordova, Valez, and Seward. The high temperatures also helped fuel wildfires and hastened the breakup of sea ice in the Chukchi Sea."
Accordingly, a large amount of relatively warm water from rivers has flowed into the Arctic Ocean, in addition to warm water from the Atlantic and Pacific Oceans.


Sea surface temperatures have been anomalously high in many places around the edges of the sea ice, as also shown on the NOAA image below.


Nonetheless, as the above images also make clear, sea surface temperatures closer to the North Pole have until now remained at or below zero degrees Celsius, with sea ice cover appearing to remain in place. The webcam below from the North Pole Environmental Observatory shows that there still is a lot of ice, at least in some parts around the North Pole.

Webcam #2 of the North Pole Environmental Observatory monitoring UPMC's Atmospheric Buoy, June 21, 2013
So, what could have caused the sea ice to experience such a dramatic thickness decline in some areas close to the North Pole?

Firstly, as discussed in earlier posts, there has been strong cyclonic activity over the Arctic Ocean (see also Arctic Sea Ice blog post). This has made the sea ice more prone and vulnerable to the rapid decline that is now taking place in many areas.

Furthermore, Arctic sea ice thickness is very low, as illustrated by the image below.

Arctic sea ice volume/extent ratio, adapted by Sam Carana from an image by Neven (click to enlarge)
Finally, there has been a lot of sunshine at the North Pole. At this time of year, insolation in the Arctic is at its highest. Solstice (June 20 or June 21, 2013, depending on time zone) is the day when the Arctic receives the most hours of sunlight, as Earth reaches its maximum axial tilt toward the sun of 23° 26'. In fact, insolation during the months June and July is higher in the Arctic than anywhere else on Earth, as shown on the image below.

Monthly insolation for selected latitudes -  adapted from Pidwirny, M. (2006), in "Earth-Sun Relationships and Insolation",  Fundamentals of Physical Geography, 2nd Edition. 
In conclusion, the current rapid sea ice thickness decline close to the North Pole is mostly due to a combination of earlier cyclonic activity and lots of sunlight, while the sea ice was already very thin to start with. The cyclone broke up the sea ice at the center of the Arctic Ocean, which is turn made it more prone to melting rapidly. The cyclone did more, though, as contributor to the Arctic-news blog Veli Albert Kallio explains:
"The ocean surface freezes if the temperature falls below -2.5C. The reason for the negative melting point is the presence of 4-5% of sea salt. Only in the polar regions does the sea surface cool sufficiently for sea ice to form during winters.

The sea ice cover is currently thinning near the North Pole between 80-90 degrees north. This part of the ocean is very deep. It receives heat of the Gulf Stream from the south: as the warm water vapourises, its salt content to water increases. This densifies the Gulf Stream which then falls onto the sea floor where it dissipates its heat to the overlying water column. The deep basin of the Arctic Ocean is now getting sufficiently warmed for the thin sea ice cover to thin on top of it. The transportation of heat to the icy surface is combined with the winds that push cold surface water down while rising heat to surface."
Indeed, vertical mixing of the water column was enhanced due to cyclonic activity, and this occurred especially in the parts of the Arctic Ocean that also are the deepest, as illustrated by the animation below.
Legend right: Ice thickness in m from Naval Research Laboratory
Legend bottom: Sea depth (blue) and land height (brown/green)
in m from NIBCAO Arctic map at NOAA
The compilation of images below shows how the decline of sea ice has taken place in a matter of weeks.

[ click to enlarge ]
This spells bad news for the future. It confirms earlier analyses (see links below) that the sea ice will disappear altogether within years. It shows that the sea ice is capable of breaking up abruptly, not only at the outer edges, but also at the center of the Arctic Ocean. As the Arctic sea ice keeps declining in thickness, it does indeed look set to break up and disappear abruptly across most of the Arctic Ocean within a few years. Models that are based on sea ice merely shrinking slowly from the outer edges inward should reconsider their projections accordingly.

Related

- Getting the Picture
http://arctic-news.blogspot.com/2012/08/getting-the-picture.html

- Supplementary evidence by Prof. Peter Wadhams
http://arctic-news.blogspot.com/2012/04/supplementary-evidence-by-prof-peter.html

Thursday, June 13, 2013

Arctic sea ice thickness falls by 2m in 21 days in some areas

For years, warnings have been raised about the dramatic decline of Arctic sea ice. Various posts at this blog have also analyzed the exponential nature of the decline in summer sea ice volume and the many feedbacks that fuel this decline. And for years, the conclusion has been that - without action - the sea ice looks set to disappear altogether within years.

Yet, many are still ignoring this warning, often with remarks such as "some of the ice is 5 meters thick; it would take decades for all that ice to melt!" Thick ice does indeed pile up along the northern coast of Greenland and Ellesmere Island, due to the way the ice drifts. This has lead some to argue that an S-shaped curve (sigmoid or gompertz trendline) was more appropriate, with the decline in sea ice volume slowing down as it approaches zero.

However, this argument doesn't seem make much sense, since such a S-shaped trendline would only apply to a relatively small area with very thick sea ice. Exponential curves would still remain the best fit to predict the decline of the sea ice in the Arctic Ocean at large.

Moreover, is it really more appropriate to say that summer sea ice looks set to virtually disappear within years, with just a tiny sliver of ice remaining north of Greenland and Ellesmere Island, instead of saying that the sea ice looks set to disappear altogether within years? How persistent will such a sliver really be?

One of the feedbacks of sea ice decline is that, as the decline progresses, cyclones can be expected to hit the remaining sea ice ever harder. How much damage can such cyclones and further feedbacks do? A previous post describes thin spots developing in the sea ice under the influence of a cyclone. The image below shows areas at the center of the Arctic Ocean (large circle) where thickness of the sea ice fell from 2 meters to 1 meters over a period of 21 days. Furthermore, the image below also shows that, over this period, 5m-thick ice was reduced to 3-meters thickness (top small circle), while 2m-thick ice was reduced to zero (bottom small circle).

2m falls in thickness in 21 days - click on image to enlarge
In conclusion, without action the Arctic sea ice looks set to continue to decline exponentially, while strong feedbacks such as cyclones developing when there is more open water, look set to add to the decline and cause the Arctic sea ice to disappear completely within years. For an overview of lines of action, see this post at the methane hydrates blog.

Thursday, June 6, 2013

Thin Spots developing in Arctic Sea Ice

From the start of 2013, Arctic sea ice extent has roughly followed the same path it did in 2012 when a historic record low was reached, as discussed in a previous post. At the moment, thinner spots are developing in the sea ice, as illustrated by the image below.


These thin spots are developing due to a combination of factors:
  • a cyclone over the Arctic
  • low North Hemisphere snow cover causing more sunlight to be absorbed, rather than reflected back into space
  • warm sea surface temperatures at edges of sea ice, as illustrated by the image below
  • ice thickness is very low, as illustrated by the image further below
NOAA image, click to enlarge
Arctic sea ice volume/extent ratio by Neven (click to enlarge image)
Below, a 30-day Naval Research Laboratory animation illustrating the development of the thinner spots. 

For the most updated version of this animation, click here. 
For years, observation-based projections have been warning that Arctic sea ice will disappear within years, with dire consequences not only for the Arctic, but for the world at large. Hopefully, more people will realize the urgency of the situation and realize the need for a comprehensive and effective plan of action as described here. 

Image adapted from TheCryosphereToday by Albert Kallio, contributor to the Arctic-news blog
Albert Kallio comments:
"NORTH POLE STORM IN MAY / JUNE 2013 AND SEA ICE SHATTERING AND COMPACTION 06/06/2013

Due to a constant thinning of the Arctic Ocean ice cover it has become sensitive to shearing by ocean wave penetration, winds and ocean currents. As a result of this weakening, a relatively small but persistent storm that centred over the North Pole managed to shatter 75%, or three quarters of Arctic Ocean's ice cover into free ice floes.

Because of the earth's spin, winds and ocean currents, the North Pole immediacy saw vast leads opening in colossal numbers, lots of broaken ice has migrated towards the Atlantic Ocean via the Fram Strait, the Barents and Kara Seas.

The situation is opposite on the Pacific Ocean end of the Arctic Ocean where ice cannot escape further south due to Eurasian and North American land barrier blocking further southward ice movements. These areas have seen densification of sea ice as the broken ice has packed against the Arctic Ocean’s perimeter coastlines.

The Arctic Ice Cover break up is a dangerous situation because the insolation (sunlight amount) and heat carryover from the continent (currently snow free) is the greatest on perimeter in far south (the Bering Strait).

The 06/06/2013 situation is suggestive that:

(1.) The high Arctic Basin will face aggressive melting as sunlight pours into the open leads of dark water, leading to opening of this part of the ocean early.

(2.) The compaction zone in Alaska will later follow the suit as the ice gets pushed against the warm coastal seas.

(3.) Despite good (near 100%) ice cover, on the compaction zone, the ice will melt also here as the heat carry over from the continent (south) is here the greatest.

(4.) The sunlight amount and the length of the annual melt season are the greatest in the far perimeters of the Arctic Ocean (around the Bering Strait).

(5.) The brokenness of sea ice cover into countless ice floes increases its three dimensional surface area in water which helps the transmission of heat from the sea water into ice. Sea water retains large thermal inertia (capacity to store heat. This melts ice when the warm sea water gets in contact with sea ice’s frozen surfaces).

(6.) Where leads occur within ice, a strong vertical mixing of sea water also increases melting.

(7.) The brokenness of North Pole’s ice cover and its reduced ice amount reduces the sea ice congestion (gridlock) making it much easier to escape to the Atlantic Ocean via the Fram Strait, the Barents and Kara Seas." 
Image adapted from University of Bremen by Albert Kallio, contributor to the Arctic-news blog
Albert Kallio, commenting on above image:
BREAK UP OF NORTH POLE SEA ICE CAP AS AT 9TH JUNE 2013

The Arctic Ocean ice cover has broken up unexpectedly early and the sea ice is particularly shattered in the viscinity of the North Pole posing huge uncertainties how the sea ice (and the polar bears, walruses and seals on it) can survive until autumn. The dark violet represents good, solid sea ice cover. The more coloured, the more shattered and reduced the sea ice cover is.

Paul Beckwith adds (extracted from Paul's June 10, 2013, blogpost  Why Arctic sea ice will vanish in 2013):
Within the last few weeks, cyclonic activity has returned and once again caused substantial thinning and weakening of the sea ice near the North Pole. Ice near the center of cyclonic activity, recently 2 to 2.5 metres thick, has thinned to roughly 1.25 metres. This in less than 2 weeks: unprecedented so early in the melt season. More significantly, in the last few days a gaping “hole” has appeared in the much thicker ice just north of the Canadian Arctic Archipelago. Ice that was recently 3.5 to 4 metres thick is now less than 2 metres thick in the hole.

The hole is likely due to a combination of divergence of the ice away from the rotating cyclone center, and the upwelling (churning up) of warm, salty sea water below. The most rapid melting and ice deterioration is occurring below the surface (where the cold surface air temperature can’t slow melting).

The magnitude of the most recent cyclonic activity is not unusual, although the persistence is. What is also new in the equation is the ability of these common cyclones to degrade the ice, and do so very early in the melt season. Also new is the substantial increase in amplitude, frequency and duration of cyclonic activity in the Arctic Ocean basin. The thinning ice cover not only breaks up easier now (even by relatively small and weak cyclones), more open water leads to an increase in melting and storm intensity.

It’s for all these reasons I find it extremely difficult to comprehend how any sea ice will be left after this year’s summer ‘melt season’.
Below, Paul Beckwith's animation Arctic sea ice thickness + motion June 10 2013, based on Naval Research Laboratory data.