Showing posts with label change. Show all posts

Saturday, February 22, 2014

With business as usual life on earth is largely doomed

by John Davies

There is a very grave crisis in the Arctic which might only be resolved if the world uses geo-engineering to cool the Arctic and there are drastic cuts in greenhouse gas emissions.

Failing that most life on earth is doomed including humanity with devastating climate catastrophe starting no later than 2015 and a runaway Greenhouse Event starting in 2014.

I am sure that with an immense effort starting now humanity can be saved.

I am trying to obtain a meeting of the All Party Parliamentary Committee on Climate Change to discuss the desperate situation in the Arctic and the prognosis that with business as usual life on earth is largely doomed and also the steps humanity must take to save the global climate in April.

[ to be continued ]


Saturday, February 8, 2014

CO2 growth highest on record

Despite many promises, global emissions of carbon dioxide (CO2) continue to grow.

NOAA figures show that 2013 CO2 level growth was the highest ever recorded, i.e. 2.95 ppm.

The EPA expects U.S. 2013 energy-related CO2 emissions to be 2% higher than in 2012.

The UC San Diego image below shows CO2 levels in the atmosphere over the past two years.

Back in September 2013, John Davies warned: The world is probably at the start of a Runaway Greenhouse Event which will end most human life on Earth before 2040. This will occur because of a massive and rapid increase in the carbon dioxide concentration in the air which has just accelerated significantly. The increasing Greenhouse Gas concentration, the gases which cause Global Warming, will very soon cause a rapid warming of the global climate and a chaotic climate.

The post featured a graph with a 4th-order polynomial trendline pointing at some 7.5 ppm CO2 annual growth by 2040. While many welcomed the warning contained in the graph, some argued against using higher-order polynomial trendlines. So, for those who don't feel comfortable with a 4th-order polynomial trendline, the graph below adds both a linear trendline and a 3rd-order polynomial trendline.


The 3rd-order polynomial trendline, based on the recent data, points at CO2 annual growth of some 7 ppm by 2040, justifying the warning sounded by the 2013 graph.

And what do the recent data say, when a 4th-order polynomial trendline is applied? As the image below shows, they show an even steeper rise, reaching 7 ppm growth per year as early as 2030.


As many posts at this blog have warned, rapid growth in greenhouse gases and numerous feedbacks are threatening to push Earth into runaway global warming. This calls for comprehensive and effective action to - among other things - reduce atmospheric CO2 levels back to 280 ppm, as illustrated by the image below and as further discussed at the Climate Plan blog.


Saturday, February 1, 2014

Abrupt Climate Change - by Paul Beckwith

by Paul Beckwith

Humans have benefited greatly from a stable climate for the last 11,000 years - roughly 400 generations. Not anymore. We now face an angry climate. One that we have poked in the eye with our fossil fuel stick and awakened. Now we must deal with the consequences. We must set aside our differences and prepare for what we can no longer avoid. And that is massive disruption to our civilizations.

In a nutshell, the logical chain of events occurring is as follows:
  1. Greenhouse gases that humans are putting into the atmosphere from burning fossil fuels are trapping extra heat in the earth system (distributed between the oceans (93%), the cryosphere (glaciers, ice sheets, sea ice for 3%), the earth surface (rocks, vegetation, etc. for 3%) and the atmosphere (only an amazingly low 1%). The oceans clearly get the lions share of the energy, and if that 1% heating the atmosphere varies there can be decades of higher or lower warming, as we have seen recently. This water vapor rises and cools condensing into clouds and releasing its stored latent heat which is increasing storm intensity.
  2. (i)Rapidly declining Arctic sea ice (losing about 12% of volume per decade) and (ii)snow cover (losing about 22% of coverage in June per decade) and (iii)darkening of Greenland all cause more solar absorption on the surface and thus amplified Arctic warming (global temperatures have increased (on average) about 0.17oC per decade, the Arctic has increased > 1oC per decade, or about 6x faster)
  3. Equator-to-Arctic temperature difference is thus decreasing rapidly
  4. Less heat transfer occurs from equator to pole (via atmosphere, and thus jet streams become streakier and wavier and slower in west-to-east direction, and via ocean currents (like Gulf Stream, which slows and overruns continental shelf on Eastern seaboard of U.S.)
  5. Storms (guided by jet streams) are slower and sticking and with more water content are dumping huge torrential rain quantities on cities and widespread regions at higher latitudes than is “normal”.
  6. A relatively rare meteorological event called an “atmospheric river” is now much more common, and injects huge quantities of water over several days to specific regions, such as Banff (with water running downhill to Calgary) and Toronto and Colorado events.
The above is extracted from one of Paul's earlier posts.

Paul discusses more details in the videos below. Our abruptly changing climate system: where we are and where we are going.

Abrupt Climate Change - part 1


And the next part, Abrupt Climate Change - part 2


Extreme weather is like a sledgehammer repeatedly pounding away at the inaction, lethargy, and climate change denial that is prevalent in rich Western countries around the world. 

Inevitably, the hammer pounding will increase in frequency, severity, duration, and spatial extent over the next few years until the denial crumbles, in spite of the annual one billion dollars in fossil fuel money that is paid to support fraud by hiding the truth on the threat that we all face. 

A tipping point in collective societal behaviour will occur, and humanity will finally initiate action, albeit frantically, to begin to deal with the largest problem ever faced in our history.


Paul Beckwith is a part-time professor with the laboratory for paleoclimatology and climatology, department of geography, University of Ottawa. He teaches second year climatology/meteorology. His PhD research topic is “Abrupt climate change in the past and present.” He holds an M.Sc. in laser physics and a B.Eng. in engineering physics and reached the rank of chess master in a previous life.

Monday, January 27, 2014

Our New Climate and Weather - part 2


by Paul Beckwith

continued from part 1

In North America we are about to experience a late January, 2014 weather event that will likely go down in the record books, at least for a few weeks until the next event. Such is life on our rapidly changing planet in Climate 2.0, or perhaps this would better be called the great abrupt climate change transition between Climate 1.0 (our old climate) and the new, much warmer Climate 2.0.

In any event, the jet stream is configuring into that two crest/two trough mode that I discussed above. An enormous plug of cold Arctic air is descending southward across North America with temperature anomalies 20 degrees C below normal (36 degrees F below normal). It likely reaches far enough south to enter into northern Mexico and to cover large parts of Florida and extend out into the Gulf of Mexico and the Atlantic, resulting in northern Florida dropping below freezing (see my YouTube video below).

For more commentary on above video, see the post Deep Freeze and Abrupt Climate Change

Meanwhile, in turn, almost the entire Arctic region is seeing huge positive temperature anomalies that are 20 degrees C above normal (36 degrees F above normal). This air is changing the Arctic circulation patterns, and although the Arctic air temperature is still below zero, it is so much warmer than normal that the thickening and area growth of sea ice is being severely curtailed. There is strong ice motion out of the Fram Strait between Greenland and Svalbard which is carrying some of the thickest ridged ice just north of the Canadian archipelago out to warmer water and destruction. In the Bering Strait the ice motion is switching between transport of warm Pacific Ocean water into the Arctic Ocean and export of cold Arctic Ocean water out into the Pacific, leading to less ice formation outside the strait.


The easternmost and westernmost edges of North America are outside the jet stream trough, and being in the ridge on either side of the trough are experiencing record warm temperatures. Snow is minimal there, and lakes that would normally have frozen long ago are open water. Further south on the west coast, California is undergoing a record drought and the Sierra Nevada snow pack which feeds the rivers and reservoirs in the state is only at 15 to 20% of normal levels. And this is the normal rainy season for California, which is the breadbasket of the nation. If this drought continues, as it has for almost 3 years, it is very likely that food prices will increase substantially across North America.

Putting on my Engineering hat, it is very clear to me that the large temperature swings over short periods of time that occur as the jet stream troughs and ridges sweep past a fixed region such as a city are wreaking havoc on infrastructure. We have commonly been getting temperature swings of 40 degrees Celsius (72 degrees F) within a day or two. These swings usually cross zero, and result in torrential rain events followed by flash freezing and then large amounts of snow, or the inverse process occurs, often in a cycle over a week. Clearly buildings, roads, railroad tracks, and pipelines are under siege from these temperature swings, precipitation changes and repeated freeze/thaw cycles.

Consider a railroad track. The rails are basically two ribbons of steel of length L separated by width w that are held in place by spikes onto wooden railroad ties. Each section L is joined to adjacent sections with spacers. The tracks are designed for a nominal temperature range. At the high end temperature, the steel expands to its maximum length, and adjacent sections butt together at the join. At the low end temperature, the steel contracts and the gap between adjacent rails is at a maximum. As the daily temperature varies between the lows and highs, the rail expands and contracts. Similarly, for seasonal changes. All within design tolerances. What we are seeing now is a higher frequency of extreme temperature swings of 40 degrees C or larger (72 degrees F), which is greatly stressing the rail infrastructure. These large swings are stretching the limits of the design tolerances since they exceed the usual daily temperature ranges, and occur way faster than any seasonal change. In combination with the explosion of rail traffic from oil trains, the risk of derailment accidents has greatly increased, and we are seeing an enormous increase in derailments. We have also seen a large increase in the frequency, amplitude, duration, and spatial area of torrential rainfall events which have led to floods and extreme river flow rates which undercuts bridges and also leads to more rail derailments. Especially when the rail is submerged for extended periods of time, as occurred, for example in Colorado in late summer 2013.

Ditto with pipelines. Pipeline sections are attached to each other via welds or sleeves and during extreme temperature swings the expansion and contraction of concern is in the longitudinal direction of the pipe. The pipelines are usually buried a few meters under the ground, which can reduce the temperature variation during the atmospheric temperature swings, however where they cross rivers and streams they are exposed to the changing elements and river flows. They are also susceptible to flash freeze events in which large sections of the ground contract and lead to cracking and soil displacement. Water saturation levels in the soils has a large effect on pipeline stresses, and can undergo rapid changes from rapidly changing precipitation cycles.

We are all familiar with how roads fare under extensive freeze/thaw cycles. Even worse, the ice melting salt corrodes guardrails, signs, and posts and as cracks open up in the asphalt salty water percolates in and the freeze thaw cycles widen the cracks leading to potholes and road breakup. And that is in northern latitude regions that have a regular snow in winter climate. In more southern regions that are unaccustomed to snow, there is widespread use of concrete for road surfaces. When there are large temperature swings the concrete is more prone to cracking and it is more difficult to remove snow and ice from these roads, since there is a lack of snow removal equipment and salt in these regions, and the concrete is lighter in color and thus absorbs less solar energy than asphalt and thus stays colder.

The biggest problem that homeowners face in more southern latitudes from these deep freeze situations, apart from personal discomfort in poorly insulated homes, is water pipe freezing and rupturing. Leaving the water taps all partially open to ensure a trickle of water flow through the pipes alleviates a lot of this problem.

In summary, climate change caused extreme weather events are severely stressing infrastructure like roads, bridges, rail, pipelines, and buildings. Much of this infrastructure was built many years ago and upgrading and maintenance has been neglected due to postponed and reduced budgets; while traffic on rail, for example has exploded in volume and weight. We are now facing the consequences of accelerated climate change and the years of neglect of our aging infrastructure.

In the video below, Paul says more about the damage to railway tracks and pipelines.


Southern Hemisphere Climate Changes

In the video below, Paul Beckwith explains how declining Arctic sea ice is causing Australia to bake and Antarctic sea ice to grow.


to be continued

Saturday, January 18, 2014

Our New Climate and Weather


by Paul Beckwith

The familiar global weather patterns that we, our parents, and our grandparents (and most of our distant ancestors, at least as far back as the last ice age remnants) have always experienced are no more. We have entered an abrupt climate change phase in which an energized water primed atmosphere and disrupted circulation patterns give rise to unfamiliar, massive and powerfully destructive storms, torrential rains, widespread heat waves and droughts, and less commonly but occasionally widespread cold spells.

Why is this happening now? Sophisticated Earth System computer Models (ESMs), summaries of state-of-the-art peer reviewed climate science (Intergovernmental Panel on Climate Change IPCC), and mainstream science have generally put the climate change threat out to the latter part of the century. Global data from all parts of the world, but most noticeably the Arctic shows that reality is quite different from these models and mainstream thinking.

Just by looking out the window much of humanity now senses that something is very different, and uncomfortably wrong in their particular region.

Depending on location, vegetation is drying out and burning, or being toppled by very high wind events, or oceans are invading upon coastlines, or rivers are overrunning banks or drying up or both, while rainfall deluges are inundating other regions. In fact some regions are vacillating between massive floods and massive droughts, or record high temperatures and record low temperatures, even on a weekly basis.

As crazy as things are now, clearly they are not bad enough to wake up the general population enough to vote down denier politicians and demand extensive governmental action on the problem. Not to worry, that action is a sure bet in the near future, the only question is will it happen next year, or in 3 years?

In the meantime, many of us are doing as much as we can to educate people on the dangers we face and speed up the understanding of climate reality process. As much as we do, ultimately it is the hammer of extreme weather, causing, for example global crop failures or taking out a few more cities in rich countries that will take the final credit for an abrupt tipping point in human behavior.

The key to the disruption in the climate system is the Arctic.

Human emissions have inexorably increased levels of carbon dioxide and methane (Greenhouse gases GHGs) in the atmosphere sufficiently to cause an incremental overall increase of global mean surface temperature by 0.8 degrees C over the last century. Over the last 3 decades, the GHGs have caused sufficient warming in the Arctic to melt enough land-covered snow and ocean covered ice such that the highly reflective surfaces have been replaced by dark underlying land and ocean greatly increasing sunlight absorption causing Arctic temperature amplification of 3x to 5x and higher.

This has melted permafrost on the land and on the shallow continental shelves and has increased Arctic methane emissions, which on a molecule-to-molecule basis cause warming >150x compared to carbon dioxide on a short timescale. Arctic temperature amplification has reduced the equator-to-Arctic temperature difference, which is responsible for setting up global circulation patterns on the rotating Earth. Thus, the high speed jet stream winds which circumvent the globe become slower, and wavier, and weather patterns change.

Extreme weather events become stronger, more frequent, of longer duration, and act on new regions. In effect, the climate background has changed, so the statistics of all weather events changes. When the ocean tide comes in all boats rise, when the climate system changes all weather events change.

So how does the North American freeze of early January, 2014 and the upcoming late January, 2014 freeze fit into this picture? In our familiar climate, the polar jet stream flowed mostly west to east (with small north-south deviations or waves, with typically 4 to 7 crests and troughs around the globe) separating cold dry Arctic air from lower latitude warmer moist air. The latitude of the jet moves southward in our winter and northward in our summer.

In our present climate the jet stream waviness has greatly increased and eastward average speed has decreased. Not only that, but in early January there were only two troughs (over North America and central Asia) and two crests (over Europe and the Pacific up through Alaska and the Bering Strait).

The troughs had temperatures 20 degrees C cooler than normal, while the crests had temperatures 20 degrees C warmer than normal. These large waves and slowing of the jet stream is directly responsible for the changes we have been experiencing in weather extremes. Cold or warm, depending on your location.

continued at part 2

Sunday, January 5, 2014

Global Warming and the Gulf Stream

Global Warming and the Gulf Stream - Our Atmospheric Pollution Roadway to Subsea Arctic Methane-Induced Climatic Hell

by Malcolm P.R. Light, 5th January, 2014

The amount of water presently transported north eastward by the Gulf Stream varies from 30 million cubic metres per second off Florida to a maximum of 150 million cubic metres per second south of Newfoundland at 55° is transported within this volume of water is approximately equal to the amount carried north east by the atmosphere which gives North Western Europe its milder climate (Wales, 2013).

The surface temperature off the Coast of the United States in the western North Atlantic shows the warm Gulf Stream (in red on Figure 1) while colder oceanic zones are in dark blue (Wales, 2013).

Figure 2 from Csanady (2001) shows the heat gain and loss for the Atlantic Ocean which was posthumously published from Bunker in (1988) In: the North Atlantic from Bunker and Worthington (1976).

Csanady (2001) says that "the contours connect points of equal heat gain in watts per square meter (Wm-2)(negative if heat is lost). The zero-gain contour cuts through this ocean along a diagonal roughly from Spain to the island of Hispaniola in the Caribbean. North of this contour the ocean loses heat, at spectacularly high rates over the warm waters of the Gulf Stream. Here the annual average rate of loss exceeds 200 watts per square meter (exceeds 250 watts per square meter off New England/Canada - my insertion). On the other side of the ocean, off the Norway coast, a northwards tongue of the Warm-Water-Sphere (Gulf Stream - my insertion) is still responsible for heat losses between 50 and 100 watts per square meter, and even higher off Lapland".

When humans get too hot their bodies perspire (sweat) water and this water evaporates at a high rate in windy conditions giving them "wind chill". The excessive heating off the Gulf Stream by pollution clouds pouring off the coast of North America is directly related to excessive heat loss in the same region (Figure 2) because the heat induced extreme atmospheric pressure change generates very strong winds which "wind chill" the overheated ocean there. Gulf Stream water temperatures range up to 13°C to 26.5°C (Hurricanes) and water in this temperature range requires about 2440 to 2470 thousand Joules of energy per kilogram for it to change from a liquid into a gaseous state (Latent heat of evaporation; Hyperphysics, 2013; Lide and Fredrickse, 1995). The loss of this latent heat of evaporation is the main reason for the extreme heat loss shown by the hot Gulf Stream waters offshore North America (Figure 2).
Figure 3. shows the yearly human carbon dioxide emissions in tons per person versus inflation adjusted income (Image from gapminder.org, 2013).

The total carbon dioxide emitted by each country is proportional to the size of the circles (Figure 3).

The United Kingdom emitted the most carbon dioxide per person at the start of the industrial revolution but the United States caught up with the U.K. at the start of the 20th century (Figure 3).

From then on the U.S.A. grew to be the largest emitter of carbon dioxide (Figure 3). An average U.S. citizen causes 3 times as much carbon dioxide to be emitted (19 tons of carbon dioxide/person) than a person in China (4.7 tons of carbon dioxide/person)(Figure 3).

China however due to its large population emits a lot of carbon dioxide in total (Figure 3). 5 states, the United Arab Emirates, Saudi Arabia, Australia, U.S.A. and Canada have the most extreme human carbon footprints on Earth (Figure 3) (Light, 2013).

Figures 4a shows the giant equatorial current gyres in the Southern and Northern Hemispheres.

The southern gyre (South Atlantic) is very symetrical, while the northern gyre (North Atlantic) shows extreme asymetry with the elongated core rotational zone lying only a short distance east of the coast of North America and the narrow Gulf Stream current here is elevated and shows the highest volume of transport (150 Sverdrups = 150 million cubic metres per second).

This extreme asymetry is due to global warming from the large volume of pollution clouds pouring off the industrialized zones along the east coast of North America.

This generates a massive atmospheric pressure gradient and accelerates the strong prevailing South Westerly wind flow.

These winds drive the Gulf Stream to high velocities and force surface waters to move offshore from Ekman transport, piling them up (Figure 4b) (Csanady, 2001).

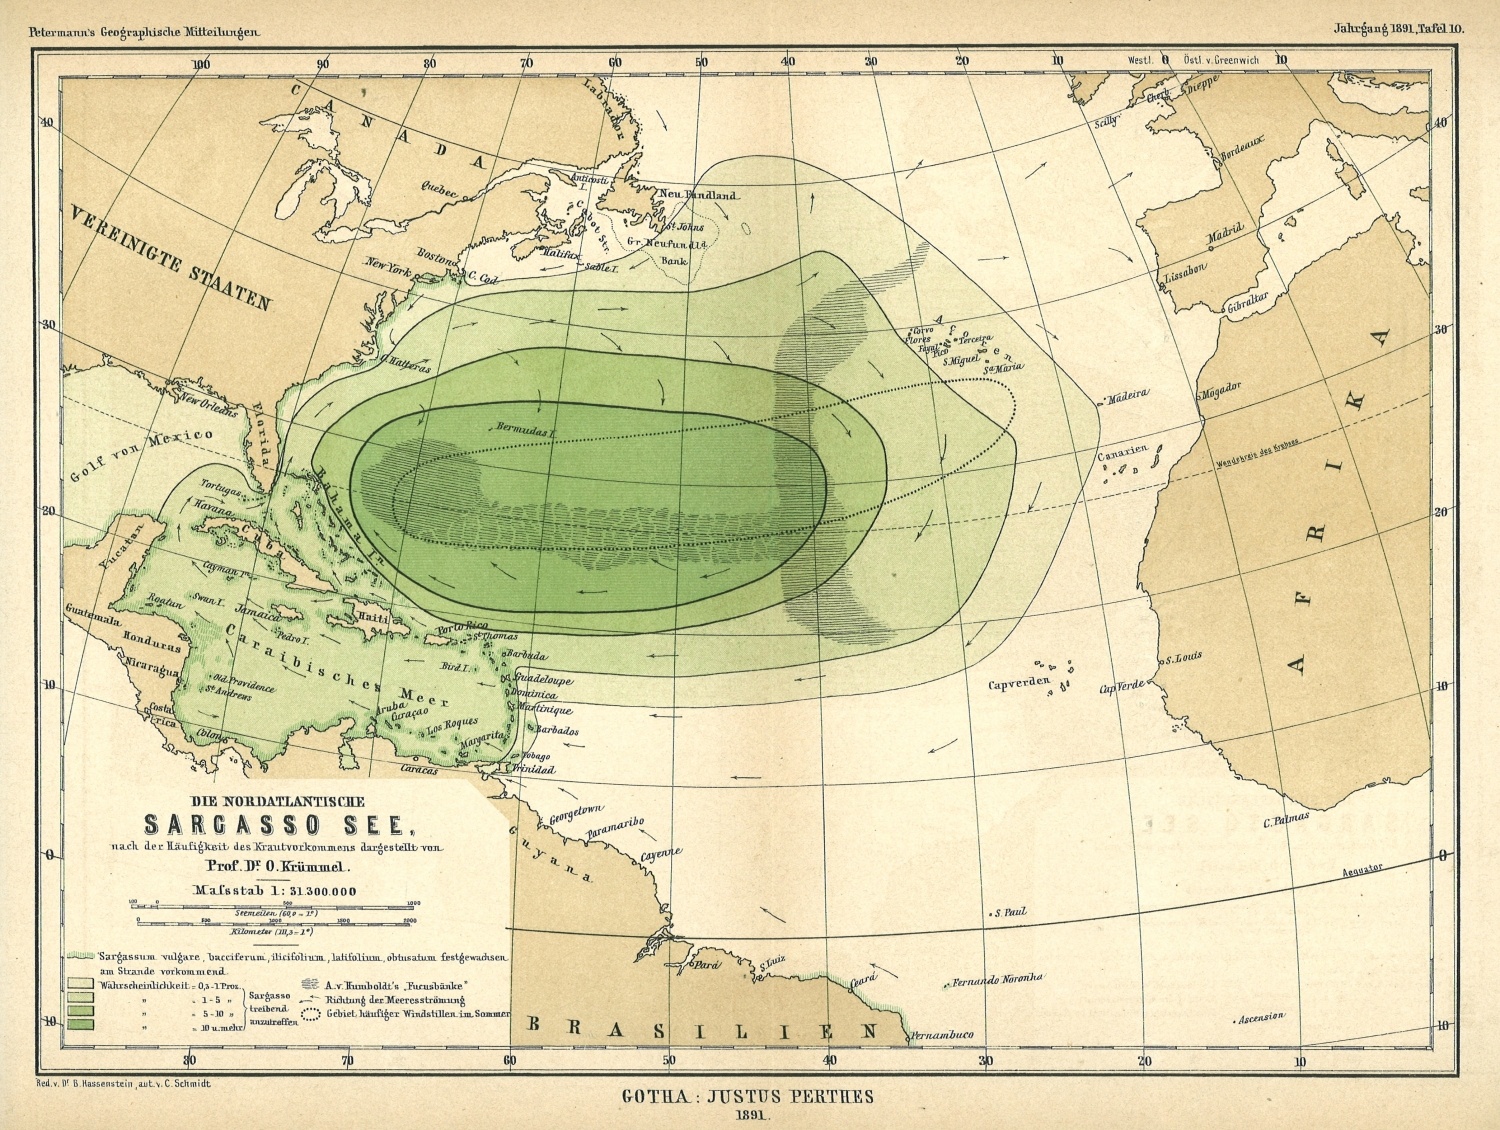
Figure 4b also shows the limited extent of the Sargasso Sea in the late 20th century.

In the late 18th century the Sargasso Sea extended over the entire middle of the North Atlantic (Figure 4c; Krummel 1891).

The extreme asymetry presently The extreme asymetry presently shown by the North Atlantic current gyre (Figure 4d) in the middle of the 20th century was caused by the migration of the rotational core zone more than 1500 km north west as the strength of the prevailing South Westerly winds picked up along the Gulf Stream offshore N. America due to the global warming caused by pollution clouds pouring offshore from the onshore U.S. industries.


The extremely high current transport rates of the Gulf Stream directly offshore the industrialized United States varied from 55 in 1942 to up to 150 Sverdrups (millions of cubic metres/second) at the present day indicating the effects of extreme global warming enhancement here (Figure 4d, Csanady, 2001; Sverdrup, Johnson and Fleming, 1942; Wales, 2013). In addition this map shows the extreme asymmetry of the North Atlantic current gyre, the heated ocean waters in the region of the Gulf Stream (line ornament) and the north east extension of the Gulf Stream via the Hebrides and Norway to the Arctic Ocean (Figure 4d, Sverdrup, Johnson and Fleming, 1942). Csanady (2001) says that:- "South of the zero-gain contour, over most of the subtropical gyre, the ocean gains heat as colder waters flow southward (Canary Current - my insertion) and absorb solar heat. The energy gain through this "cold water advection" process being, however, moderate, typically 25 watts per square meter. In this region, evaporation is also high, raising the salinity of surface waters". Figure 4d. shows the hot north - east trending Gulf Stream feeding into the North Atlantic Drift and a number of south east trending higher salinity branches which flow clockwise back into the extreme surface salinity zone in the North Atlantic (Weather - online 2012).

The spectacular rates of heat loss from the Gulf Stream waters off the coast of the United States can be clearly followed north east to Norway where they split into the eastern Yermack branch entering the Barents Sea and the West Spitzbergen (Svalbard) Current which dives beneath the floating Arctic Ice Cap (Figure 2). This northward pointing tongue of hot and saline Gulf Stream water is also clearly visible on the salinity map (Figure 5) as strong inflexions in the contours first west of Ireland and then south of Svalbard just before the Gulf Stream dives beneath the floating Arctic Ice cap as the West Spitzbergen Current (Figure 5).


The Gulf Stream (West Spitzbergen Current) follows the southern shelf edge of the Arctic Eurasian Basin to the Laptev Sea destabilizing the subsea Arctic methane hydrates en route and releasing ever increasing amounts of methane into the Arctic atmosphere (Figure 6). The West Spitzbergen Current is still losing some 50 watts per meter by the time it reaches the floating ice cap west of Svalbard but the shallower eastern Yermack Current looses much larger amounts of heat (100 - 600 watts per metre depending on the seasons). Häkkinen and Cavalieri, 1989 indicate that in mid-winter off Lapland, heat losses reach 600 watts per square meter while in August they range from 20 to 40 watts per square meter, where the ice-sheet edge stops any exchange of heat from the sea to the air.

Figures 7, 8 and 9 show the yearly north-eastward Gulf Stream transport of the energy (watts) from the North Atlantic Sub-Tropical Gyre to the Arctic Ocean. The map uses Gulf Stream flow volumes in Sverdrups (= one million cubic metres/second) calibrated to the heat flow trend from eight measured heat flow values along the Gulf Stream (Csanady, 2001). The calibration constant is 3.85 x ten to the power of 7. The heat flow data comes from Csanady, 2001; Gulf Stream flow volumes from Sverdrup, Johnson and Fleming, 1942, Wales J., 2013 and the University of California, (CDL, 2013).
The Gulf Stream shows a zone of anomalously large global warming heating, extremely high rates of South Westerly wind induced ocean current flow, extreme wind chill (caused by evaporation of the sea surface) and elevation of the surface of the Gulf Stream along the coast of the industrialized United States and Canada (Figures 7 to 9 and Figure 4b).
Quite clearly the global warming caused by pollution clouds pouring off the coast of the industialized United States is generating a large air pressure differential, accelerating and heating the prevailing South Westerly Wind flow with its consequent wide ranging effects on the Gulf Stream seen as far north as the central Arctic. As mentioned previously this global warming has increased the rate of water transport from 55 Sverdrups in 1942 to up to 150 Sverdrups at the present (Sverdrup et al. 1942, Wales, 2013).

The heat necessary to liberate methane from the methane hydrates in the Arctic Ocean and cause runaway global warming, total deglaciation and extinction in 2052 represents only one thousandth of the total amount of heat being added to the Arctic ocean by the Gulf Stream (Figure 9). The Yermack Current (E. extension of the Gulf Stream) in the Barents Sea intersects the West Spitzbergen Current (W. extension of the Gulf Stream) at the junction of the Eurasian Basin/Laptev Sea (Figure 7 - 9). This represents an extreme subsea - atmospheric methane emission point above a zone of hydrothermal methane hydrates formed on the Gakkel ridge where it enters the Laptev Sea (Light 2013).

Human-induced global warming caused by the burning of fossil fuels is found to be continuous when the ice, land and atmosphere heating data (Church et al. 2011) is combined with the 5 - year average ocean heat content to a depth of 2000 metres (Levitus et al. 2012)(Figure 10a. Nuccitelli et al. 2012).

The lack of incorporation of this data in the global warming equation by the IPCC, is the reason for the extreme 50 year error found in estimating the floating Arctic ice cap melt time using global atmospheric models as discussed in previous papers (Light 2012, Light 2013). The rate of increase of global warming heat is equivalent to 8 x ten to the power of 21 joules per year (Nuccitelli et al. 2012). The ocean has absorbed 93.4 percent of the heat from global warming (Figure 10b, ACS 2013). The total amount of heat generated by human induced global warming between 1990 and 2010 is some 14 x ten power 22 joules which is equivalent to an absorbed energy flux of 2.2 x ten power 14 watts, i.e about 0.5 watts per square metre of the earth's surface (ACS 2013).
The relative amount of human-induced global warming energy in watts being added every year to the oceans, ice, land and atmosphere and being transferred by the Gulf Stream to the subsea Arctic methane hydrates is shown in Figure 11 (Nuccitelli et al. 2012).

Methane release rates from the East Siberian Arctic Shelf (Shakova et al, 2013) combined with the area of the Arctic Ocean have been used to determine mean methane release rates for the entire Arctic Ocean (Light, 2013). If only a few percent of the subsea methane hydrate reserves in the Arctic Ocean (some 1000 billion tons of Carbon) are dissasociated and the methane released to the atmosphere, it will cause total delaciation and a major extinction event (Light and Solana 2002. The energy necessary to produce these Arctic methane release rates require only about one thousandth of the heat energy input from the Gulf Stream to dissociate the methane hydrates (Figure 11).
Furthermore the energy necessary to produce these Arctic methane release rates represent less than one millionth of the global warming heat energy being added to the oceans, ice, land and atmosphere by human fossil fuel burning (Figure 11). The total human induced global warming is equivalent to 4 Hiroshima atomic bombs detonating every second (Nuccitelli et al. 2012).

Humanity has signed its death warrant and our final extinction will be carried out by Mother Earth within the next 30 to 40 years unless we immediately take extremely drastic action to entirely curb our carbon dioxide pollution, eliminate large quantities of methane from the subsea Arctic Ocean, seawater and atmosphere (down to ca 750 ppm) and revert completely to renewable energy.

The rate of water transport of the Gulf Stream off the industrialized United States, south of New Foundland at 55° (Sverdrup et al. 1942) to 150 Sverdrups by 2013 (Wales, 2013). This is a 95 Sverdrup increase in transport over 71 years, at a rate of 1.338 Sverdrups/year equivalent to 1.85 x ten to power 14 watts/year using the conservative factor derived in figure 13.85 x ten to power 7 to covert Sverdrups to energy transport in watts/year. Previous analysis of earthquake activity, Arctic ice cap melt back data and the mean atmospheric methane content of the atmosphere indicate that the Arctic methane hydrate (clathrate) gun began to fire continuously in 2007 and the world is now far advanced into runaway global warming which will increase the mean temperature of the atmosphere by 8 degrees C by the mid 21st century (2050 - 2052)(Light 2013). This will lead to total deglaciation and a major extinction event. (Light 2013). The critical transport in 2007 off the Gulf Stream offshore the indutrialized United States, directly south of New Foundland at 55° west longitude is 42 Sverdrups which precipitated the start of the continuous firing of the methane hydrate (clathrate) gun and runaway global warming.

The Gulf Stream transport rate started the methane hydrate (clathrate) gun firing in the Arctic in 2007 when its energy/year exceeded 10 million times the amount of energy/year necessary to dissociate subsea Arctic methane hydrates. Therefore the United States and Canada must sharply reduce their airborne pollution from fossil fuel extraction and use, to cut back the Gulf Stream transport rate to less than 142 Sverdrups south of New Foundland at 55° west longitude. Here the Gulf Stream transport rate should be reduced to below 130 Sverdrups or even 100 Sverdrups to make sure that the methane hydrate (clathrate) gun completely terminates firing in the subsea Arctic. Unless this is done immediately humanity will be facing complete extinction in a methane induced firestorm by the middle of this century.

Our Only Hope for Survival

Light (2013) clearly showed the required massive reduction in global warming fossil fuel burning emissions that the United States and Canada must undertake immediately, if there is any faint hope of stopping the runaway global warming that is now underway (since 2007). The power, prestige and massive economy of the United States has been built on cheap and abundant fossil fuels and Canada is now trying to do the same. The present end of the financial crisis and recovery of the U.S. economy will take us down the same fossil fuel driven road to catastrophe that the U.S. has followed before. Unless the United States, Canada reduce their extreme carbon footprints (per unit population) (Figures 29 and 30), they will end up being found guilty of ecocide and genocide as the number of countries destroyed by the catastrophic weather systems continues to increase.

The United States and Canada with their expanding economies and their growing frenetic extraction of fossil fuels, using the most environmentally destructive methods possible (fracking and shale oil) as well as the population's total addiction to inefficient gas transport is leading our planet into suicide. We are like maniacal lemmings leaping to their deaths over a global warming cliff. What a final and futile legacy it will be for the leader of the free world to be remembered only in the log of some passing alien ship recording the loss of the Earth’s atmosphere and hydrosphere after 2080 due to human greed and absolute energy ineptitude.

The U.S. Government and Canada must ban all environmentally destructive methods of fossil fuel extraction such as fracking, extracting shale oil and coal and widespread construction of the now found to be faulty hydrocarbon pipeline systems. All Federal Government subsidies to fossil fuel corporations, for fossil fuel discovery and extraction must be immediately eliminated and the money spent solely on renewable energy development which will provide many jobs to the unemployed. All long and short range (high consumption) fossil fuel transport must be electrified and where the range is too large, electrical trains must be used instead of trucks for transport. All the major work for this conversion and railway construction can provide a new and growing set of jobs for the unemployed. Nuclear power stations must continue to be used and should be converted to the safe thorium energy system until the transition is complete.

The U.S. has to put itself on a war footing, recall its entire military forces and set them to work on the massive change over to renewable energy that the country needs to undertake, if it wishes to survive the fast approaching catastrophe. The enemy now is Mother Nature who has infinite power at her disposal and intends to take no prisoners in this very short, absolutely brutal, 30 to 40 year war she has begun. I cannot emphasise more, how serious humanity’s predicament is and what we should try to do to prevent our certain final destruction and extinction in the next 30 to 40 years if we continue down the present path we are following .

Monitoring the Effects of a Reduction in Atmospheric Pollution from the United States and Canada

In conjuction with the massive cut back in pollution emissions by the United States and Canada, the United States must set up a project through the Woods Hole and Rutgers universities to continuously monitor the Gulf Stream flow rate offshore the industrialized United States south of New Foundland at 55° the critical transport rate of 142 Sverdrups. As already shown, the critical transport in 2007 off the Gulf Stream of 142 Sverdrups precipitated the start of the continuous firing of the methane hydrate (clathrate) gun and runaway global warming. As the United States and Canada sharply reduce their airborne pollution from fossil fuel extraction and use, it will cut back the Gulf Stream transport rate to less than 142 Sverdrups south of New Foundland at 55° west longitude. Here the Gulf Stream transport rate should be reduced to below 130 Sverdrups or even 100 Sverdrups to make sure that the methane hydrate (clathrate) gun completely terminates firing in the subsea Arctic and humanity has some breathing space to give it time to completely revert to renewable energy. The Gulf Stream transport rate monitoring work of the Woods Hole and Rutgers universities will be of vital significance in humanities last ditch attempt at surviving the fast approaching extinction event.


References

ACS 2013. Thermal Energy in the Ocean. ACS Climate Science toolkit/Oceans, Ice and Rocks.
http://www.acs.org/content/acs/en/climatescience/oceanicerocks/thermalenergy.html

Balmaseda M.A., Trenberth K.E., Källén E., 2013. Distinctive climate signals in reanalysis of global ocean heat content. Geophysical Research Letters, Vol. 40, Issue 9, 1754 - 1759.

Bryden, H.L., 1979. Poleward heat flux and conversion of available potential energy in Drake Passage. J. Marine Res., 37, 1 - 22.

Bunker A.F. 1976. Computations of Surface Energy Flux and Annual Air-Sea Interaction Cycles of the North Atlantic Ocean. Mon. Wea. Rev. 104, 1122 - 1139.

Bunker A.F. 1988. Surface Energy Fluxes in the South Atlantic Ocean. Mon. Wea. Rev. 116, 809 - 829.

Bunker A.F., and Worthington V., 1976. Energy Exchange Charts of the North Atlantic Ocean. Bull. Amer. Meteor. Soc. 57, 670 - 678.

Carana, S. 2011a. Runaway Warming 2011. Geo-engineering blog
http://geo-engineering.blogspot.com/2011/09/runaway-warming.html

Carana, S. 2011b. Runaway global warming 2011. Knol
http://knol.google.com/k/sam-carana/runaway-global-warming/7y50rvz9924j/64

Carana, S. 2011g. Runaway Global Warming. In: Climate Change the Next Generation.
http://climatechangepsychology.blogspot.com/2011/04/sam-carana-runaway-global-warming.html

Carana, S. 2012. Striking increase of methane in the Arctic. In: Arctic News
http://arctic-news.blogspot.com/2012/05/striking-increase-of-methane-in-arctic.html

Carana S., 2012. Record levels of greenhouse gases in the Arctic. Arctic News. Wednesday, May 2, 2012.
http://www.3.bp.blogspot.com/hBD8fyXU_A/T6E7CIJEZWI/AAAAAAAACrM/4IU5JVN3rTO/S1600/846537569836.jpg

Carana S., 2012. The accumulating impact of methane releases in the Arctic and how much time there is left to act.
http://arctic-news.blogspot.com/p/how-much-time-is-there-left-to-act.html

Carana S., 2012. How much time is there left to act? Abrupt release of 1 Gt of methane.
http://arctic-news.blogspot.com/p/how-much-time-is-there-left-to-act.html

Carana S., 2013. Quantifying Arctic Methane.
http://arctic-news.blogspot.com/2013/11/quantifying-arctic-methane.html

Carana S., 2013. Methane - hydrates.
http://methane-hydrates.blogspot.com/2013/04/methane-hydrates.html

Carana S., 2013. Methane up to 2241 ppb at 742 mb on January 23, 2013. In: Carana S., 2013, Dramatic increase in methane in the Arctic in January 2013.
http://arctic-news.blogspot.com/2013/02/dramatic-increase-in-methane-in-the-arctic-in-january-2013.html

Carana S., 2013. Global warming, accelerated warming in the Arctic and runaway global warming. - How much will temperatures rise?.
http://arctic-news.blogspot.com/2013/04/how-much-will-temperatures-rise.html

Carana S., 2011b. Light, M.P.R. and Carana, S. 2011c. Knol - A unit of Knowledge - Methane linked to seismic activity in the Arctic.
http://knol.google.com/k/sam-carana/methane-linked-to-seismic-activity-in/7y50rvz9924j/85?collectionId=7y50rvz9924j.39#

CDL, 2013. The Oceans, their Physics, Chemistry and General Biology. UC Press E-Books Collection, 1982 - 2004. University of California Press. California Digital Library (CDL).
http://publishing.cdlib.org/ucpressebooks/view?docId=kt167nb66r&chunk.id=d3_5_ch15&toc.id=ch15&toc.depth=1&brand=eschol

Church J.A., White N.J., Konikow L.F., Domingues C.M., Cogley G., Rignot E., Gregory J.M., van den Broeke M.R., Monagham A.J., Velicogna I., 2011. Revisiting the Earth's sea - level and energy budgets from 1961 to 2008. Geophysical Research Letters. Vol. 40, Issue 15, 4066. Article first published online 8 Aug. 2013.

Cook J. 2013. 4 Hiroshima bombs worth of heat per second. In: Skeptical Science.
http://www.skepticalscience.com/4-Hiroshima-bombs-worth-of-heat-per-second.html

Csanady G.T., 2001. Air - Sea Interactions. Laws and Mechanisms. Cambridge University Press. 239 pp.

Gapminder, 2012. Yearly Human Carbon Dioxide Emissions
http://www.gapminder.org/world

Häkkinen S., and Cavalieri D.J., 1989. A study of oceanic surface heat fluxes in the Greenland, Norwegian and Barents Seas. J. Geophys. Res. 94, 6145 - 6157.

Hyperphysics, 2013. Heat of Fusion, Heat of Vaporization.
http://hyperphysics.phy-astr.gsu.ed/hbase/thermo/phase2.html

Krümmel D.O., 1891. Die Nordatlantische Sargasso Sea. Map. Scale 1:31300.000. Gotha: Justus Perthes.
http://www.gc.noaa.gov/images/gcil/1891_SargassoSee_Krummel_Petermanns_lores.jpg

Levitus et al. 2012. Global Ocean Heat Content. NOAA/NESDIS/NODS Ocean Climate Laboratory. Updated from Levitus et al. 2012. Global Oceanic Heat and Salt Content. In: NOAA National Oceanographic Data Center (NODS), United States Department of Commerce.
http://www.nodc.noaa.gov/OCS/3M_HEAT_CONTENT/Index.html

Lide R., and Frederickse H.P.R., 1995. CRC Handbook of Chemistry and Physics. 75th Edition. 1-1 to 1-33.

Light M.P.R., 2012. Global extinction within one human lifetime as a result of a spreading atmospheric Arctic methane heatwave and surface firestorm. Arctic-News.
http://arctic-news.blogspot.com/p/global-extinction-within-one-human.html

Light M.P.R., 2013. The Non - Disclosed Extreme Arctic Methane Threat. The 2013 Australian above average temperatures set a record of 0.22oC higher than the 12 month period prior to 2013 and confirm a mid - 21st century atmospheric methane - induced global deglaciation and major extinction event.
https://sites.google.com/site/runawayglobalwarming/the-non-disclosed-extreme-arctic-methane-threat

Light M.P.R. 2011a. Use of beamed interfering radio frequency transmissions to decompose Arctic atmospheric methane clouds. Edited by Sam Carana.
http://arctic-news.blogspot.com/p/decomposing-atmospheric-methane.html

Light M.P.R. 2011c. Stratospheric methane global warming veil. Edited by Sam Carana. In: Arctic News.
http://arctic-news.blogspot.com

Light M.P.R., 2012a. Global exctinction within one human lifetime as a result of a spreading atmospheric methane heatwave and surface firestorm. Edited by Sam Carana. In Arctic News.
http://arctic-news.blogspot.com

Light M.P.R., 2012b. How much time is there left to act, before methane hydrate releases will lead to human extinction? Edited by Sam Carana. In: Geo-Engineering.
http://Geo-Engineering.blogspot.com

Light M.P.R. 2012c. Angels Proposal - A Proposal for the Prevention of Arctic Methane Induced Catastrophic Global Climate Change by Extraction of Methane from beneath the Permafrost/Arctic Methane Hydrates and its Storage and Sale as a Subsidized "Green Gas" Energy Source. LGS. 49 pp. In: Arctic News.
http://arctic-news.blogspot.com.es/2012/05/proposal-to-extract-store-and-sell.html

Light M.P.R. and Carana, S., 2011. Methane linked to seismic activity in the Arctic. Edited by Sam Carana. In: Arctic News.
http://arctic-news.blogspot.com

Light M.P.R. and Solana C., 2002a. Arctic methane hydrates - Mapping a potential greenhouse gas hazard. Abstract and Poster, EGS, Nice.

Light, M.P.R. and Solana, C. , 2002b- Arctic Methane Hydrates: A Potential Greenhouse Gas Hazard
http://adsabs.harvard.edu/abs/2002EGSGA..27.4077L

Murphy D.M., Solomon S., Portmann R.W., Rosenlof K.H., Forster P.M., Wong T., 2009. An obervationally based energy balance for the Earth since 1950. Journal of Geophysical Research: Atmospheres (1984 - 2012), Vol. 114, Issue D17, 16 September 2009.

Nuccitelli D., Way R., Painting R., Church J., Cook J., 2012. Comment on "ocean heat content and Earth's radiation imbalance.II Realtion to climate shifts". Physics Letters A. Vol. 376, Issue 45, 1 October 2012, 3466 - 3468.

Rutgers, 2013a. Atlantic Ocean Gyre Map.
http://www.i-cool.org/wp-content/uploads/2010/02/ce058700fg0010.gif

Rutgers, 2013b. South Atlantic Gyre. I-Cool. International Coalition of Ocean Observing Laboratories. http://www.i-cool.org/?p=4916

Shakova N., 2013. A thawing ocean floor pours methane into the atmosphere and it's only getting worse. PRI. Science. Tech and Environment.
http://www.pri.org/stories/2013-12-12/thawing-ocean-floor-pours-methane-atmosphere-and-its-only-getting-worse

Sverdrup, Johnson and Fleming, 1942. In; introduction to Physical Oceanography.
http://oceanworld.tamu.edu/resources/ocng_textbook/chapter 11/chapter11_04.htm
http://publishing.cdlib.org/ucpressebooks/view?docId=kt167nb66r&doc.view=popup&fig.ent=http://publishing.cdlib.org/ucpressebooks/data/13030/6r/kt167nb66r/figures/kt167nb66r_fig187.gif

Wales J., 2013.
- Wikipedia; Gulf Stream.
http://www.en.wikipedia.org/wiki/File:Golfstrom.jpg
- Wikipedia; Methane.
http://www.en.wikipedia.org/wiki/Methane
- Wikipedia; South Atlantic Gyre
http://www.en.wikipedia.org/wiki/File:South_Atlantic_Gyre.png
- Wikipedia; West Spitsbergen Current
http://www.en.wikipedia.org/wiki/West-Spitsbergen-Current
- Wikipedia; Sverdrup
http://www.en.wikipedia.org/wiki/Sverdrup

Weatheronline, 2013.
http://www.weatheronline-co.uk/reports/wxfacts/North-Atlantic-Drift-Gulf-Stream.htm


Tuesday, October 8, 2013

Abrupt Climate Change

What is Abrupt Climate Change?

Abrupt climate change is defined by the IPCC as a large-scale change in the climate system that takes place over a few decades or less, persists (or is anticipated to persist) for at least a few decades, and causes substantial disruptions in human and natural systems.

Examples of components susceptible to such abrupt change are clathrate methane release, tropical and boreal forest dieback, disappearance of summer sea ice in the Arctic Ocean, long-term drought and monsoonal circulation.

Deposits of methane clathrates below the sea floor are susceptible to destabilization via ocean warming.

Anthropogenic warming will very likely lead to enhanced methane emissions from both terrestrial and oceanic clathrates.

Above extracted from:
- Intergovenmental Panel on Climate Change (IPCC), AR5 Workgroup 1, Technical Summary

New Finding Shows Climate Change Can Happen in a Geological Instant

The Paleocene/Eocene thermal maximum (PETM) is a climate shift that occurred 55 million years ago.

James Wright, Rutgers University Research News -
Morgan Schaller, James Wright, and the core sample
that helped them understand what happened
– and how fast it happened – 55 million years ago.
In a new paper in the Proceedings of the National Academy of Sciences, Morgan Schaller and James Wright present their finding that climate change can and did happen abruptly, or in geological terms, instantaneously.

Following a doubling in carbon dioxide levels, the surface of the ocean turned acidic over a period of weeks or months and global temperatures rose by 5 degrees centigrade – all in the space of about 13 years.

“We’ve shown unequivocally what happens when CO2 increases dramatically – as it is now, and as it did 55 million years ago,” James Wright said.

The film below goes into more detail regarding the current situation.

New Film: Last Hours

The film “Last Hours” describes a science-based climate scenario where a tipping point to runaway climate change is triggered by massive releases of frozen methane. Methane, a powerful greenhouse gas, has already started to percolate into the open seas and atmosphere from methane hydrate deposits beneath melting arctic ice, from the warming northern-hemisphere tundra, and from worldwide continental-shelf undersea methane pools.

“Last Hours” is narrated by Thom Hartmann and directed by Leila Conners. Executive Producers are George DiCaprio and Earl Katz.


For more, also watch some of Thom Hartmann’s interviews.

High Methane Levels persist over Arctic Ocean

High methane levels are prominent over the Arctic Ocean, as illustrated by the image below, covering a period from October 3, 2013, 10:54 am to October 7, 2013, 11:53 pm. The fact that methane has not been present elsewhere in such high concentrations over this period indicates that the methane wasn't carried there by the wind from elsewhere. Also, methane typically appears to move along the same latitude, due to the Coriolis effect.


The image indicates a link between seismic activity and destabilization of methane that is held in sediments under the Arctic Ocean. Methane does show up prominently along the fault line that crosses the Arctic Ocean and extends into Siberia over the Laptev Sea.

The Diagram that IPCC failed to include in AR5

The diagram below shows global warming evolving into accelerated warming in the Arctic. Feedbacks such as albedo changes and methane release speed up this process, triggering abrupt climate change and finally extinction.

The Diagram the IPCC failed to include in AR5

This threatening situation calls for an Effective and Comprehensive Climate Plan, such as depicted by the green lines of action in the image below and as further described at the ClimatePlan blog. For more background, see related posts further below.


Related posts

- Just do NOT tell them the monster exists
http://arctic-news.blogspot.com/2013/10/just-do-not-tell-them-the-monster-exists.html

- Methane Release caused by Earthquakes
http://arctic-news.blogspot.com/2013/09/methane-release-caused-by-earthquakes.html

- Climate Plan
http://climateplan.blogspot.com


Sunday, October 6, 2013

Just do NOT tell them the monster exists

The Arctic Methane Monster

As discussed in a previous post, the IPCC appears to be acting as if there was a carbon budget to divide among countries, whereas in reality there is a huge carbon debt to our children, while the situation could become catastropic any time soon.

Indeed, carbon dioxide is not the only greenhouse gas and the Arctic methane monster is threatening to disrupt the cosy lifetyle of those who want to keep selling parts of such non-existing carbon budgets.

So, who do you think the IPCC has been listening to, to reach a conclusion after six years of analysis? Experts or snake oil sellers? The cartoon may give you a hint, but why don't you make up your own mind by going over the IPCC statements and comments below.

Abrupt Climate Change

The IPCC recently issued AR5 documents that included a discussion of Abrupt Climate Change.

from: IPCC AR5 Working Group 1 Technical Summary (final draft)
The IPCC gives some examples:


Yes, methane release from clathrates sounds scary.


If there is little consensus on the likelyhood, then surely some experts do believe it is likely. Yet, the IPCC somehow reaches the following conclusion, and does so with high confidence:


Unlikely? What was the basis for this IPCC conclusion? 

This seems like a conclusion that can only have been reached after a robust analysis of all the evidence. So, how did the IPCC reach this conclusion, given that it did so with such high confidence?

Let's have a look. The above conclusion is preceeded by this statement:


OK, that means clathrates will increasingly become destablilized. The IPCC then adds an argument why this would not result in abrupt climate change this century.


Sure, but that's just one rather insignificant negative feedback, compared to the many more significant positive feedbacks, such as melting causing isostatic rebound that can contribute to the occurrence of earthquakes and landslides, in turn triggering methane release. Yet, without even mentioning these positive feedbacks, the paragraph then jumps to the following conclusion:


If these initial estimates are not insignificant and if it's all rather difficult to formally assess, how then is it possible that the IPCC reached its end-conclusion with such high confidence? Moreover, was there any basis for these "initial estimates"? Perhaps there's more elsewhere in the IPCC documents. Here's another paragraph that preceeded the above.


All this expresses is low confidence in existing modeling and lack of understanding of the various processes. Again, how then is it possible that the IPCC reached its conclusion with such high confidence?

How much methane is currently released from hydrates?

On this, the IPCC says:


OK, so things could become scary. And sure, there are no large abrupt releases taking place now, but that doesn't mean there's not going to be any in future. In case of gradual processes, it makes sense to base projections on historic releases. In case of abrupt releases, however, current releases should not be the basis for reaching a conclusion with high confidence.

So, was the work of Dr. Natalia Shakhova perhaps used as the basis for these estimates? Read on!

How much methane is stored under the Arctic Ocean?

How much methane is present in sediments under the seabed of the Arctic Ocean, in the form of free gas and hydrates? On this, the IPCC says in FAQ6:


That doesn't seem to reflect the estimates of Dr. Natalia Shakhova. The total amount of methane currently in the atmosphere is about 5 Gt. Saying that more than 50 Gt of methane could be stored in hydrates the Arctic seems deceptive and appears to be seriously downplaying a very dangerous situation.

Natalia Shakhova et al. in 2010 estimated the accumulated potential for the East Siberian Arctic Shelf (ESAS) region alone (image on the right) as follows:
  • organic carbon in permafrost of about 500 Gt
  • about 1000 Gt in hydrate deposits
  • about 700 Gt in free gas beneath the gas hydrate stability zone.
Back in 2008, Natalia Shakhova et al. considered release of up to 50 Gt of predicted amount of hydrate storage as highly possible for abrupt release at any time. Did the IPCC perhaps misread the figures, mistaking the part of the methane that is ready for abrupt release for the total amount of methane in the Arctic?

How long could it take for large amounts of methane to reach the atmosphere?

How long could it take for large amounts to reach the atmosphere? On this, the IPCC says in FAQ6, in the same and the next paragraph:


Events in which most, if not virtually all methane that escaped from the seabed did enter the atmosphere have been studied in 2002 and published in 2006, as reported at:
http://www.ia.ucsb.edu/pa/display.aspx?pkey=1482
and at:
http://onlinelibrary.wiley.com/doi/10.1029/2005GB002668/abstract

Below, a screenshot from an interview of John Mason with Natalia Shakhova, published at:
http://www.skepticalscience.com/arctic-methane-outgassing-e-siberian-shelf-part2.html


In conclusion, Dr Natalia Shakhova also rejects the idea that methane release from hydrates always takes place gradually, over a long time. Especially in the Arctic, there's a huge danger of abrupt release, given the accelerated warming that takes place in the Arctic, given the huge amounts of methane stored in sediments in the form of free gas and methane, given the presence of a tectonic fault line, etc, etc.

Once released, methane won't get broken down easily in the Arctic Ocean, as this requires the presence of bacteria that can oxidize the methane, as well as free oxygen in the water. Once depleted, oxygen isn't quickly replenished in the Arctic Ocean. Lack of bacteria and depletion of oxygen in the waters of the Arctic Ocean could prevent oxidation of methane rising up in the waters, as described at:
http://methane-hydrates.blogspot.com/2012/03/large-areas-of-open-ocean-starved-of.html

In the Arctic, low temperatures mean there are less bacteria that need more time to break down the methane. In other places, currents may bring bacteria back to the location of the methane plume repeatedly. In the Arctic, many currents are long, so once bacteria have flow away from the location of the plume, they could be driven out of the Arctic Ocean or may return only after a long time, i.e. too long to survive in Arctic waters which are cold and often ice-covered, so a lot of time little or no sunshine penetrates the waters.

In the Arctic, the danger is much larger that methane releases will overwhelm the capacity of bacteria to break it down in the water. In case of large abrupt releases in the Arctic, the danger is that much of the methane will reach the atmosphere unaffected and remain there for a long time, due to the Jet Stream and the low levels of hydroxyl in the Arctic atmosphere, as further described at:
http://methane-hydrates.blogspot.com/2013/04/methane-hydrates.html

BTW, how did all this methane manage to reach the atmosphere over the Arctic Ocean? 

Methane levels over the Arcic Ocean appear to be rising, as illustrated by the combination of images below, showing methane levels over five years (2009 on the left, to 2013 on the right), each time for the same period (January 21-31) - images by Dr. Leonid Yurganov.

[ Click on image to enlarge - from: Dramatic increase in methane in the Arctic in January 2013 ]
If the IPCC was right, how then was it possible methane levels to rise so sharply and abruptly. How was it possible for large amounts of methane to be present over the deep waters of the Arctic Ocean, as discussed at:
http://arctic-news.blogspot.com/2013/10/methane-over-deep-waters-of-arctic-ocean.html

[ How did this methane get there? - click on image to enlarge - see also: Methane over deep waters of Arctic Ocean ]
There is a wealth of evidence from scientists such as Igor Semiletov and Natalia Shakhova who have - year after year - been taking measurements in the East Siberian Arctic Shelf, complete with first-hand reports that methane plumes have been detected.

"We've found continuous, powerful and impressive seeping structures more than 1,000 metres in diameter. In a very small area, less than 10,000 square miles, we have counted more than 100 fountains, or torch-like structures, bubbling through the water column and injected directly into the atmosphere from the seabed," Dr Semiletov said, "We carried out checks at about 115 stationary points and discovered methane fields of a fantastic scale - I think on a scale not seen before. Some of the plumes were a kilometre or more wide and the emissions went directly into the atmosphere - the concentration was a hundred times higher than normal."  -  Vast methane 'plumes' seen in Arctic ocean as sea ice retreats, by Steve Connor in The Independent, December 13, 2011.

The image below shows a cluster of methane plumes, over one km in diameter, that appeared in the Laptev Sea end September 2011. The image is part of a paper on the unfolding "Methane Catastrophe".


Of course, we all wished that we're wrong about this terrifying Arctic methane threat, but the precautionary principle demands a thorough investigation of observations that appear to be at odds with wishful thinking, especially when the stakes are so high. So, IPCC, where's the evidence?


Related

- Arctic Methane Monster
http://arctic-news.blogspot.com/2013/09/arctic-methane-monster.html

- Methane over deep waters of Arctic Ocean
http://arctic-news.blogspot.com/2013/10/methane-over-deep-waters-of-arctic-ocean.html

- Methane hydrate myths
http://methane-hydrates.blogspot.com/p/myths.html

- Methane hydrates
http://methane-hydrates.blogspot.com/2013/04/methane-hydrates.html

- Methane release caused by earthquakes
http://arctic-news.blogspot.com/2013/09/methane-release-caused-by-earthquakes.html

- Earthquake hits Laptev Sea
http://arctic-news.blogspot.com/2013/09/earthquake-hits-laptev-sea.html

- North Hole
http://arctic-news.blogspot.com/2013/09/north-hole.html

- Seismic activity, by Malcolm Light and Sam Carana (2011)
Arctic-news.blogspot.com/p/seismic-activity.html

- Thermal expansion of the Earth's crust necessitates geoengineering (2011)
Arctic-news.blogspot.com/p/thermal-expansion.html